Dataset Assay Tools#
The Dataset Assay page is where you explore, filter, and score the sequences in an uploaded assay dataset. It brings together four tools: Predict, Clustering, and Advanced Filters, plus an Antibody settings panel that appears automatically on antibody datasets. This page describes what each tool does and how to use it.
For an end-to-end walkthrough that combines these tools to select hits from an NGS antibody library, see Antibody hit selection from NGS data.
1. Predict#
Purpose: Use a trained or pre-trained foundation model across all sequences in your dataset to generate predicted score columns that enable ranking, filtering, and visualization of your candidates.
How to open#
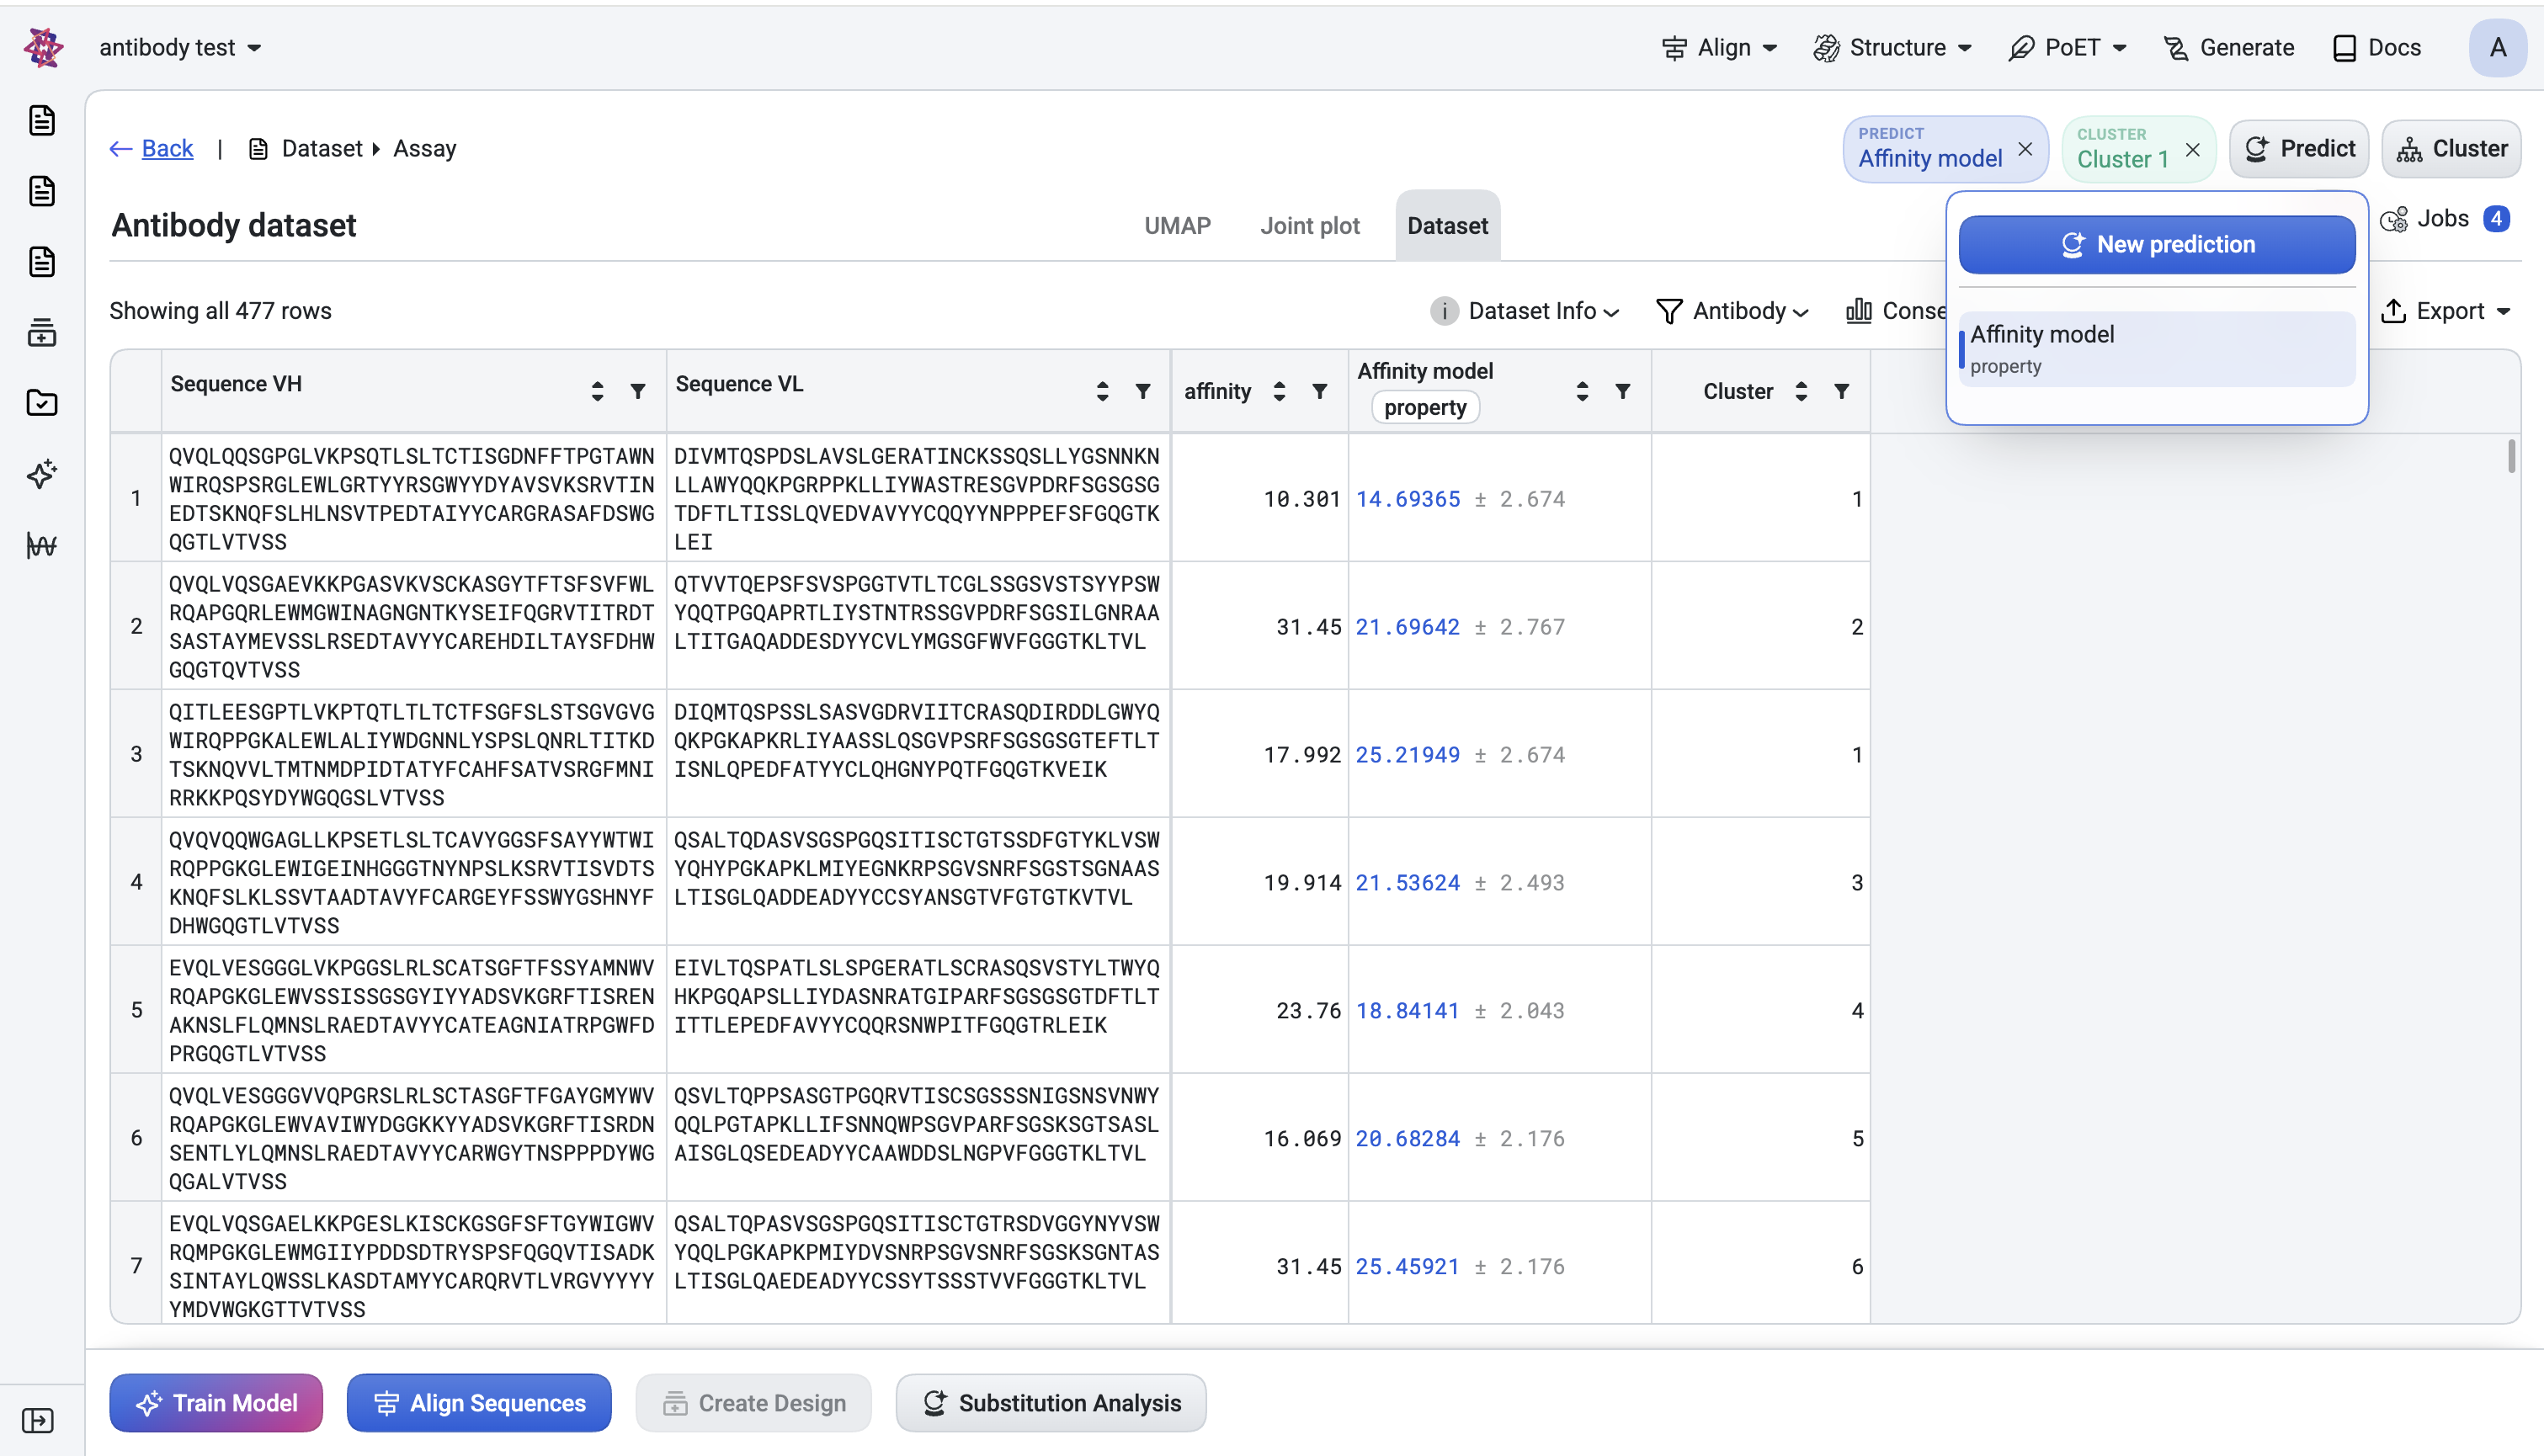
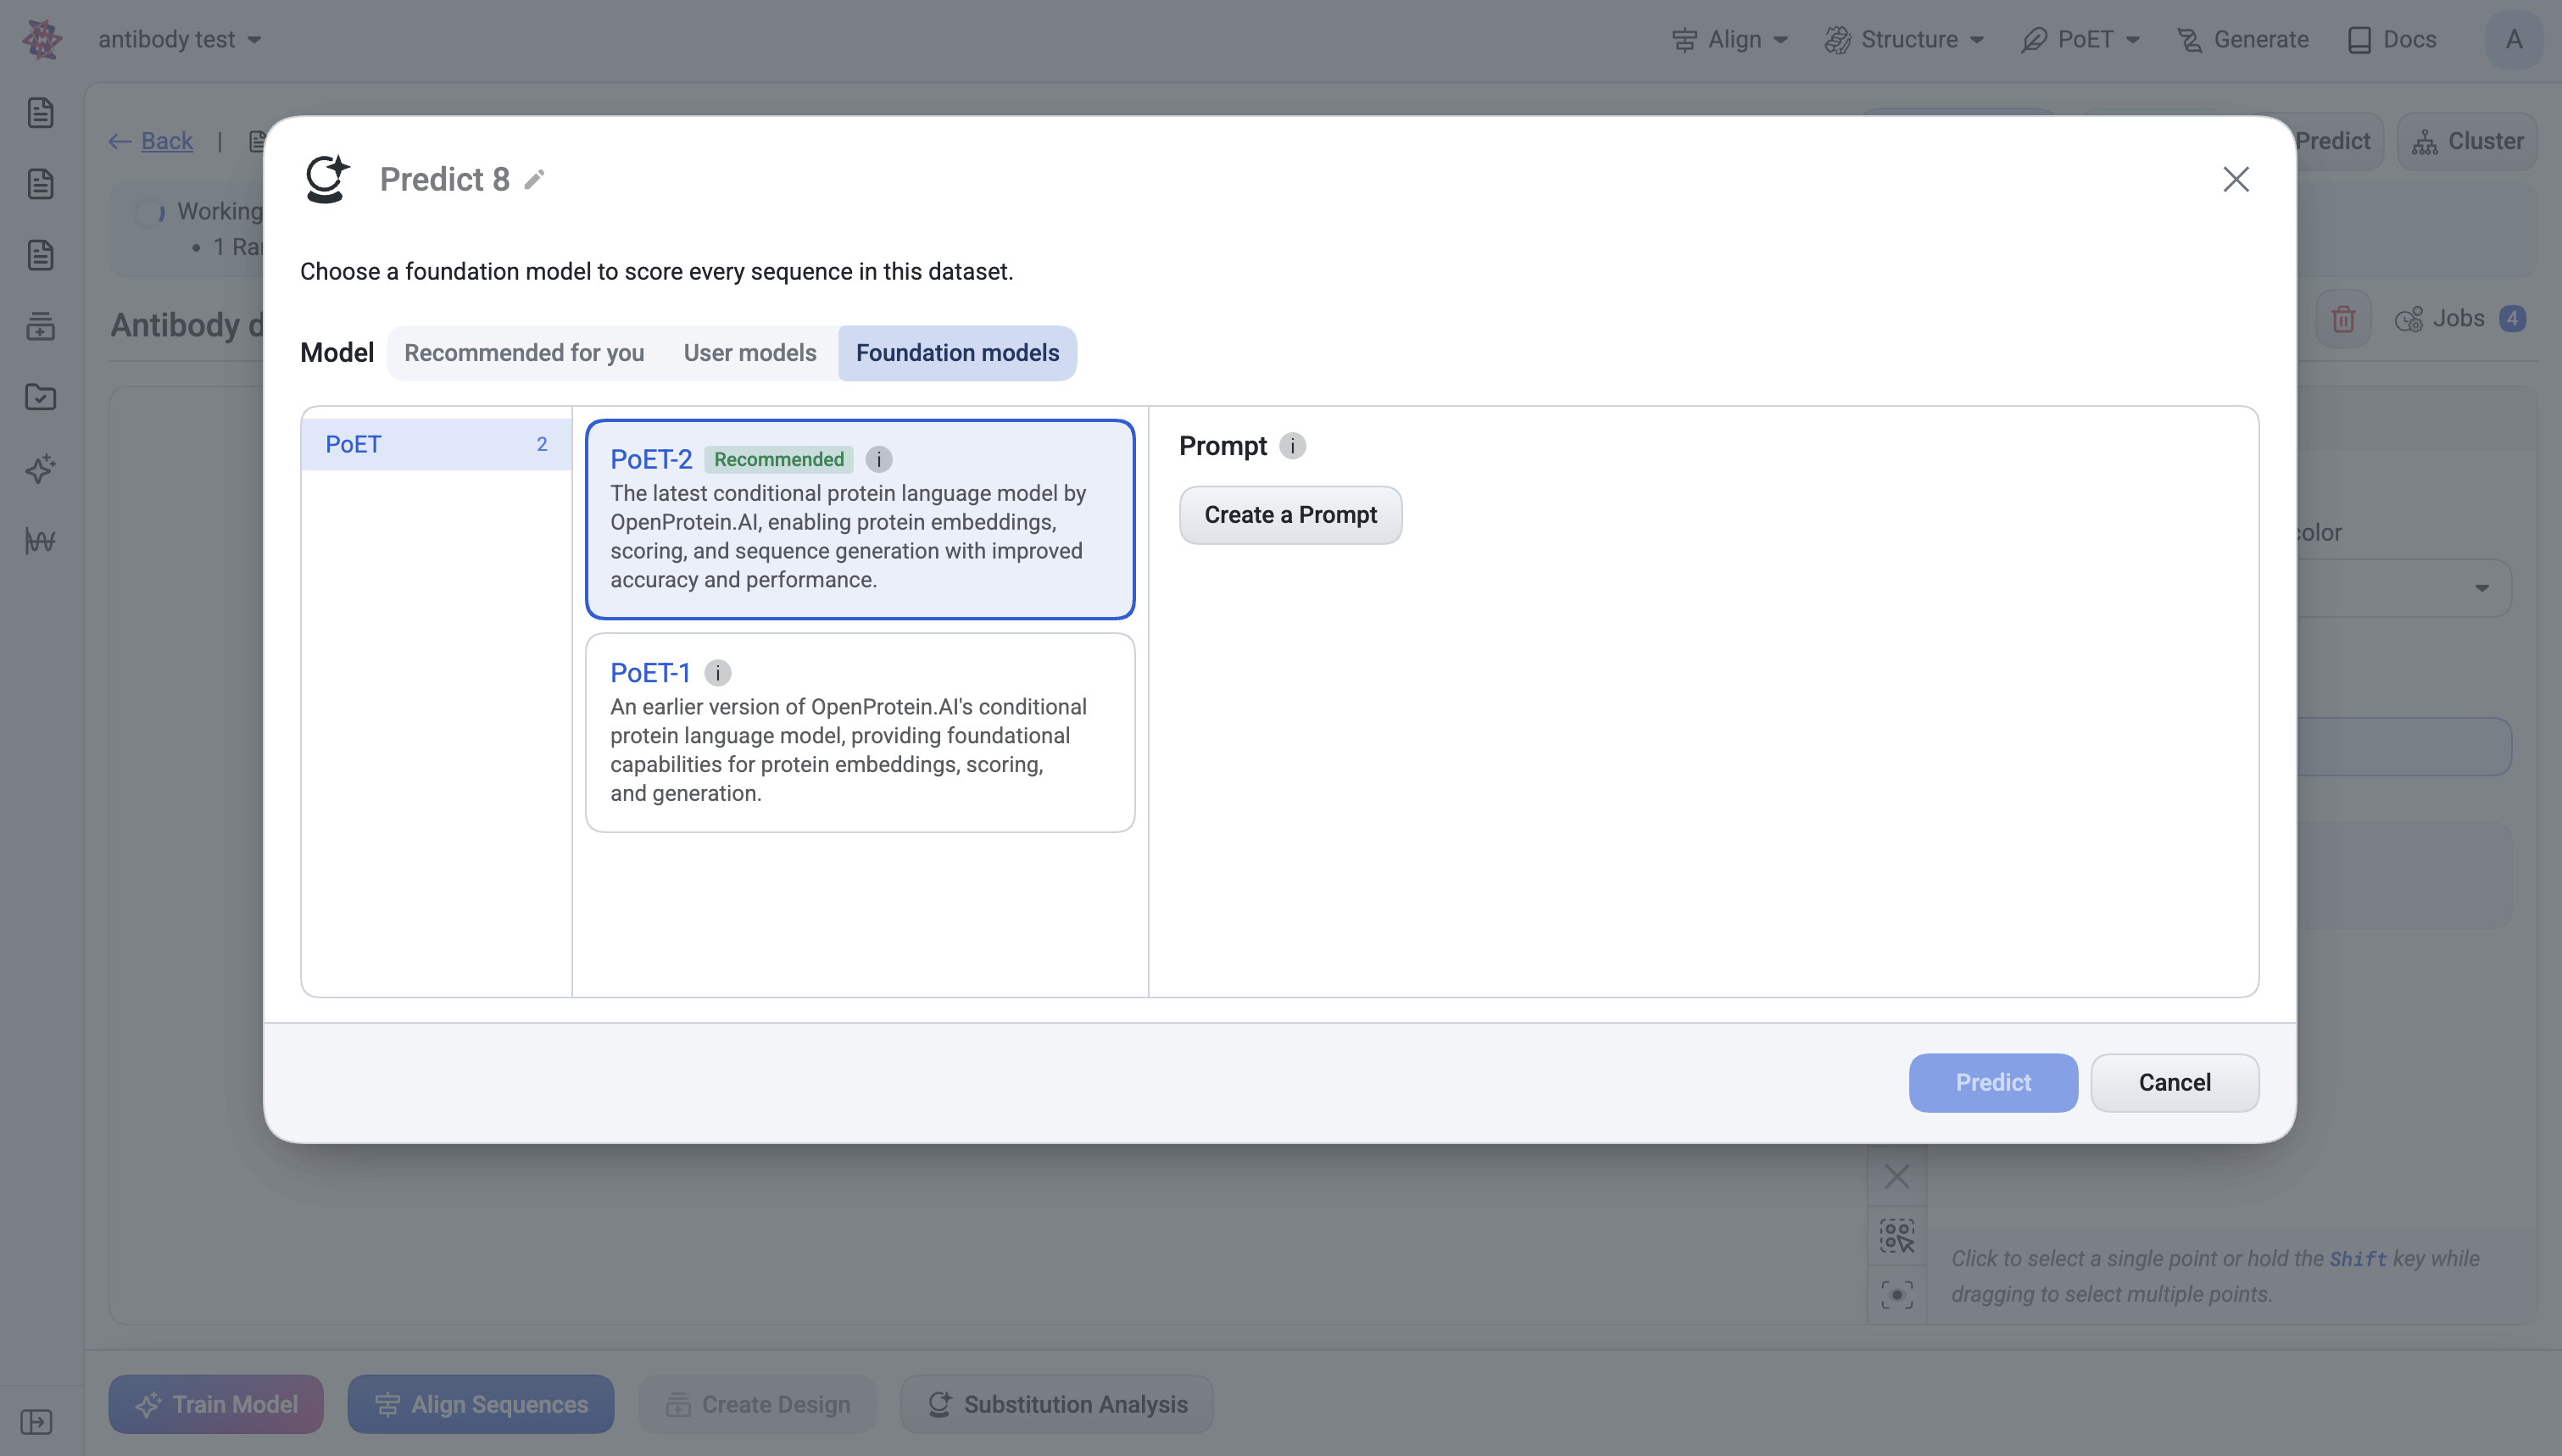
Click Predict in the header → New prediction.
The dialog lets you name the run (defaults to
Predict 1,Predict 2, …).
What you choose#
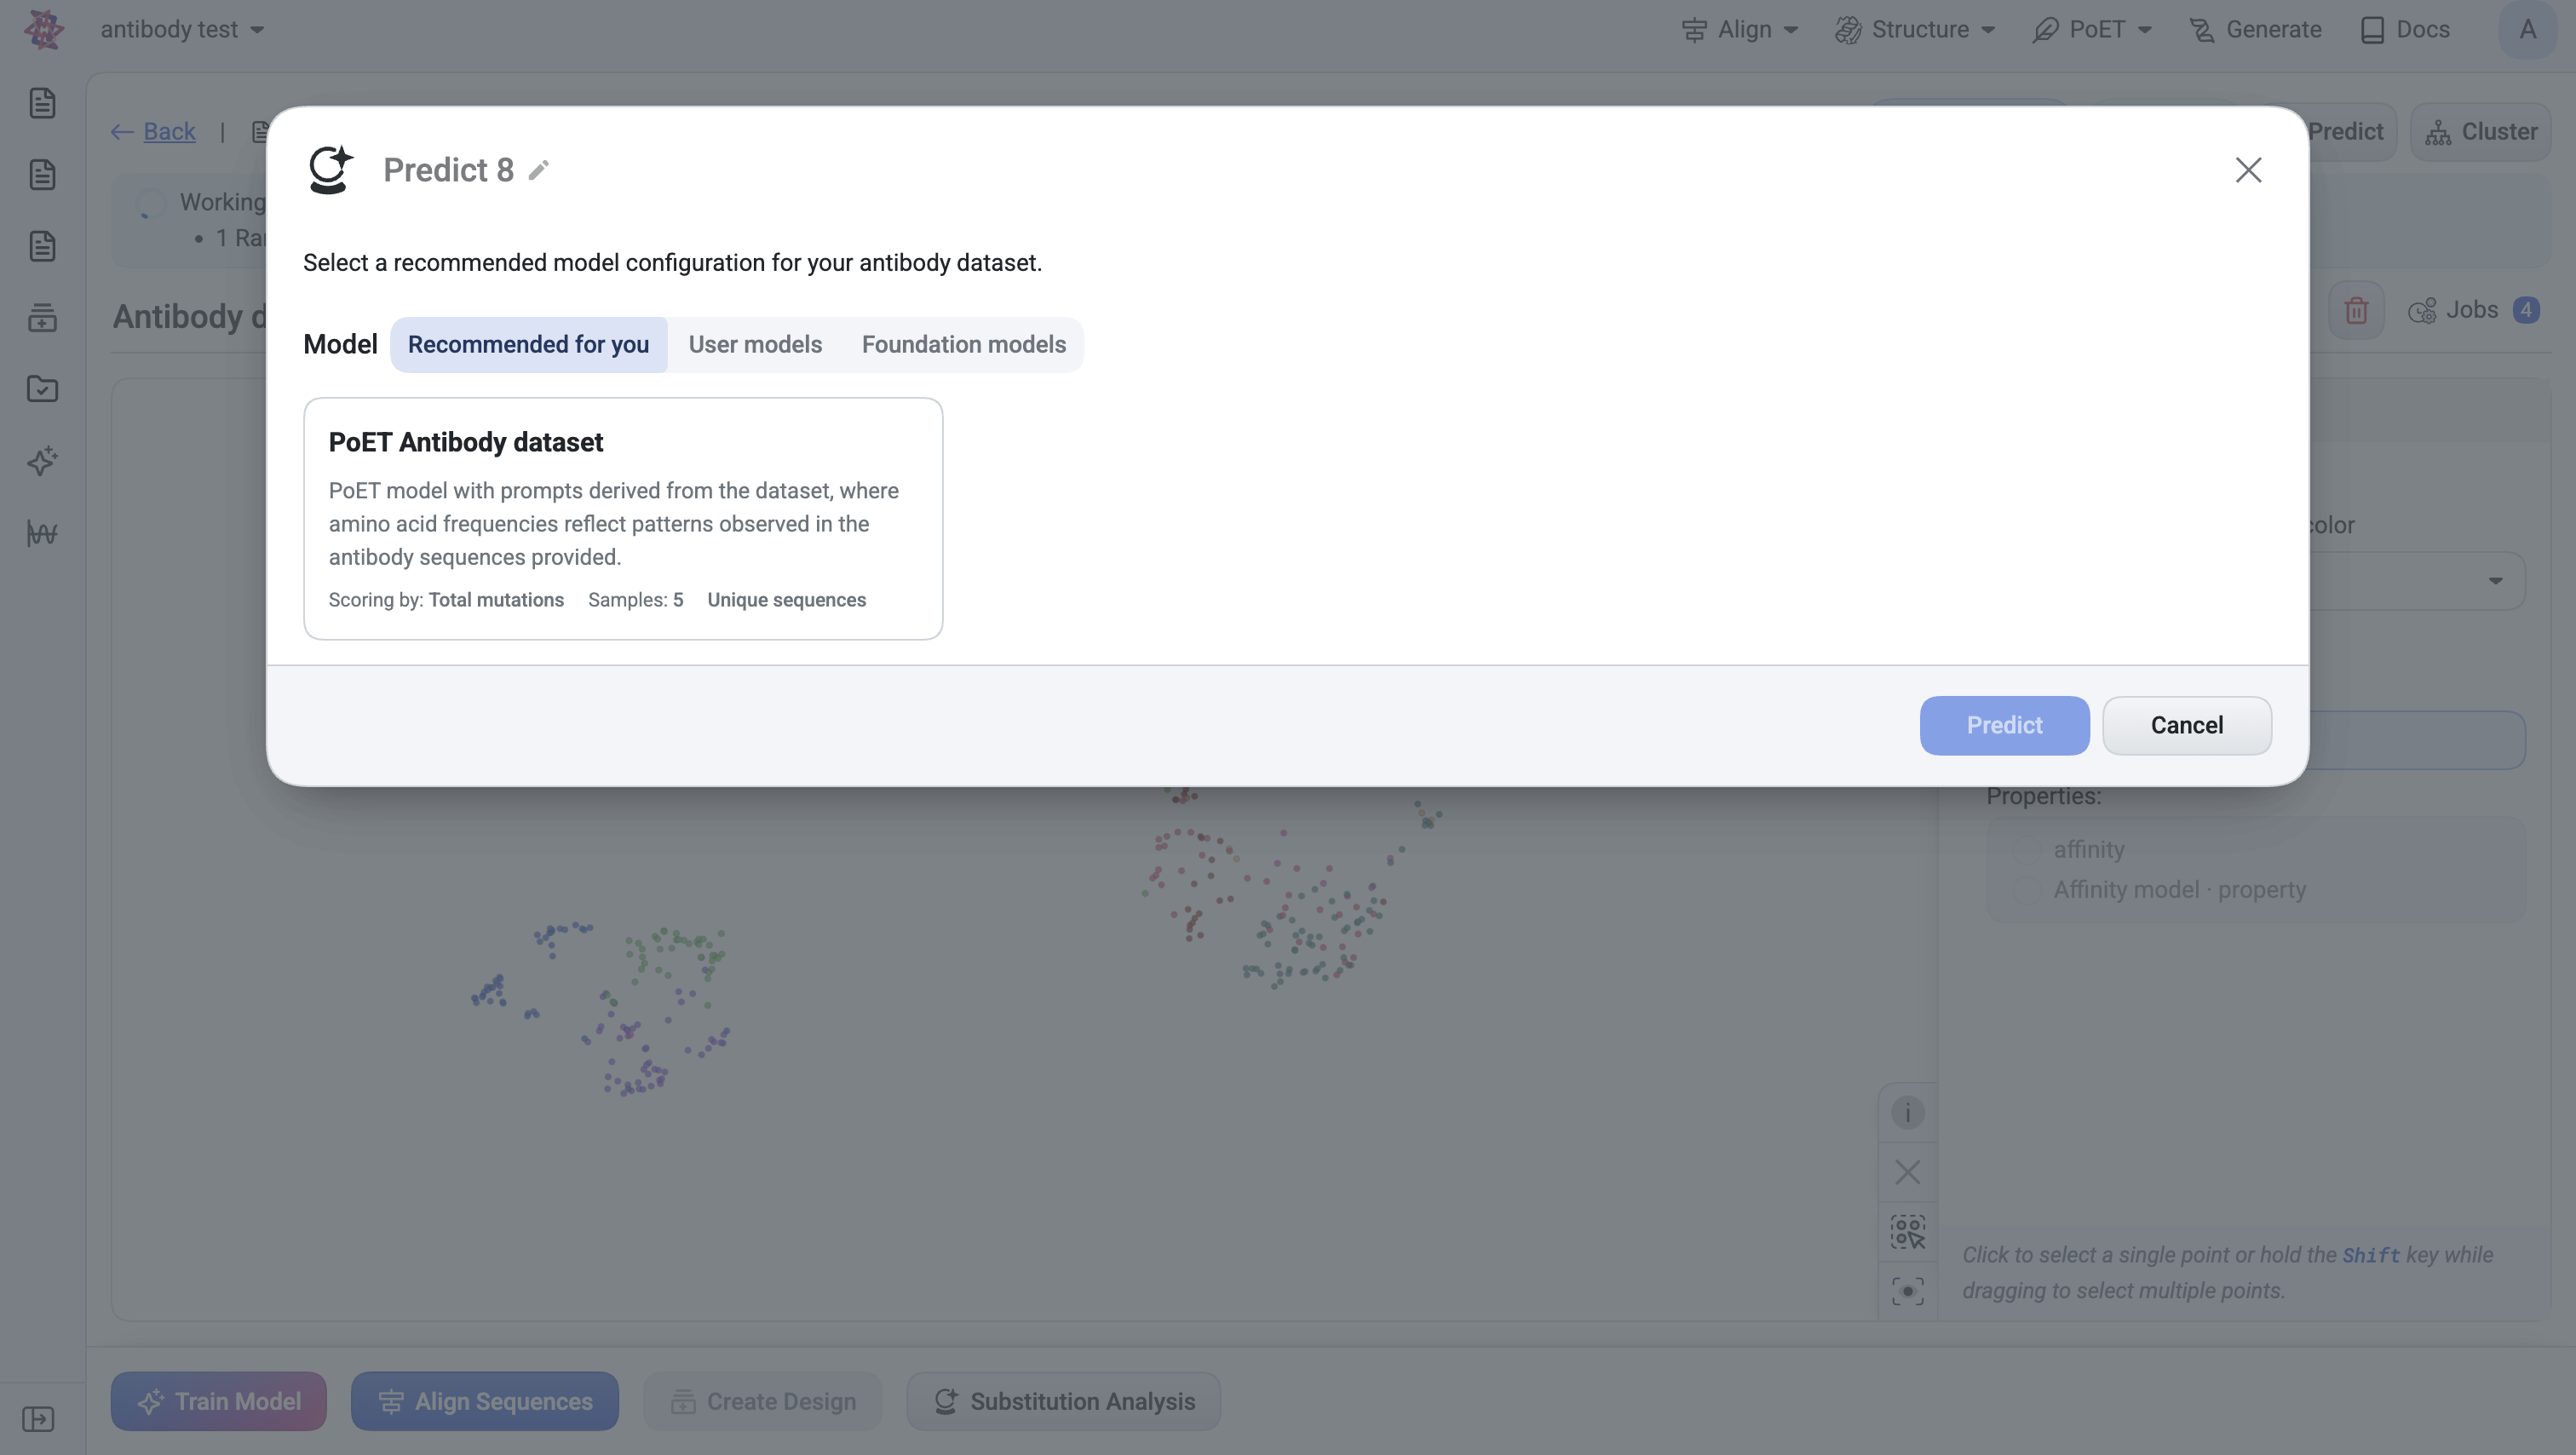
Model category:
Recommended for you — appears only on antibody datasets; preset configurations tailored to the dataset’s annotations.
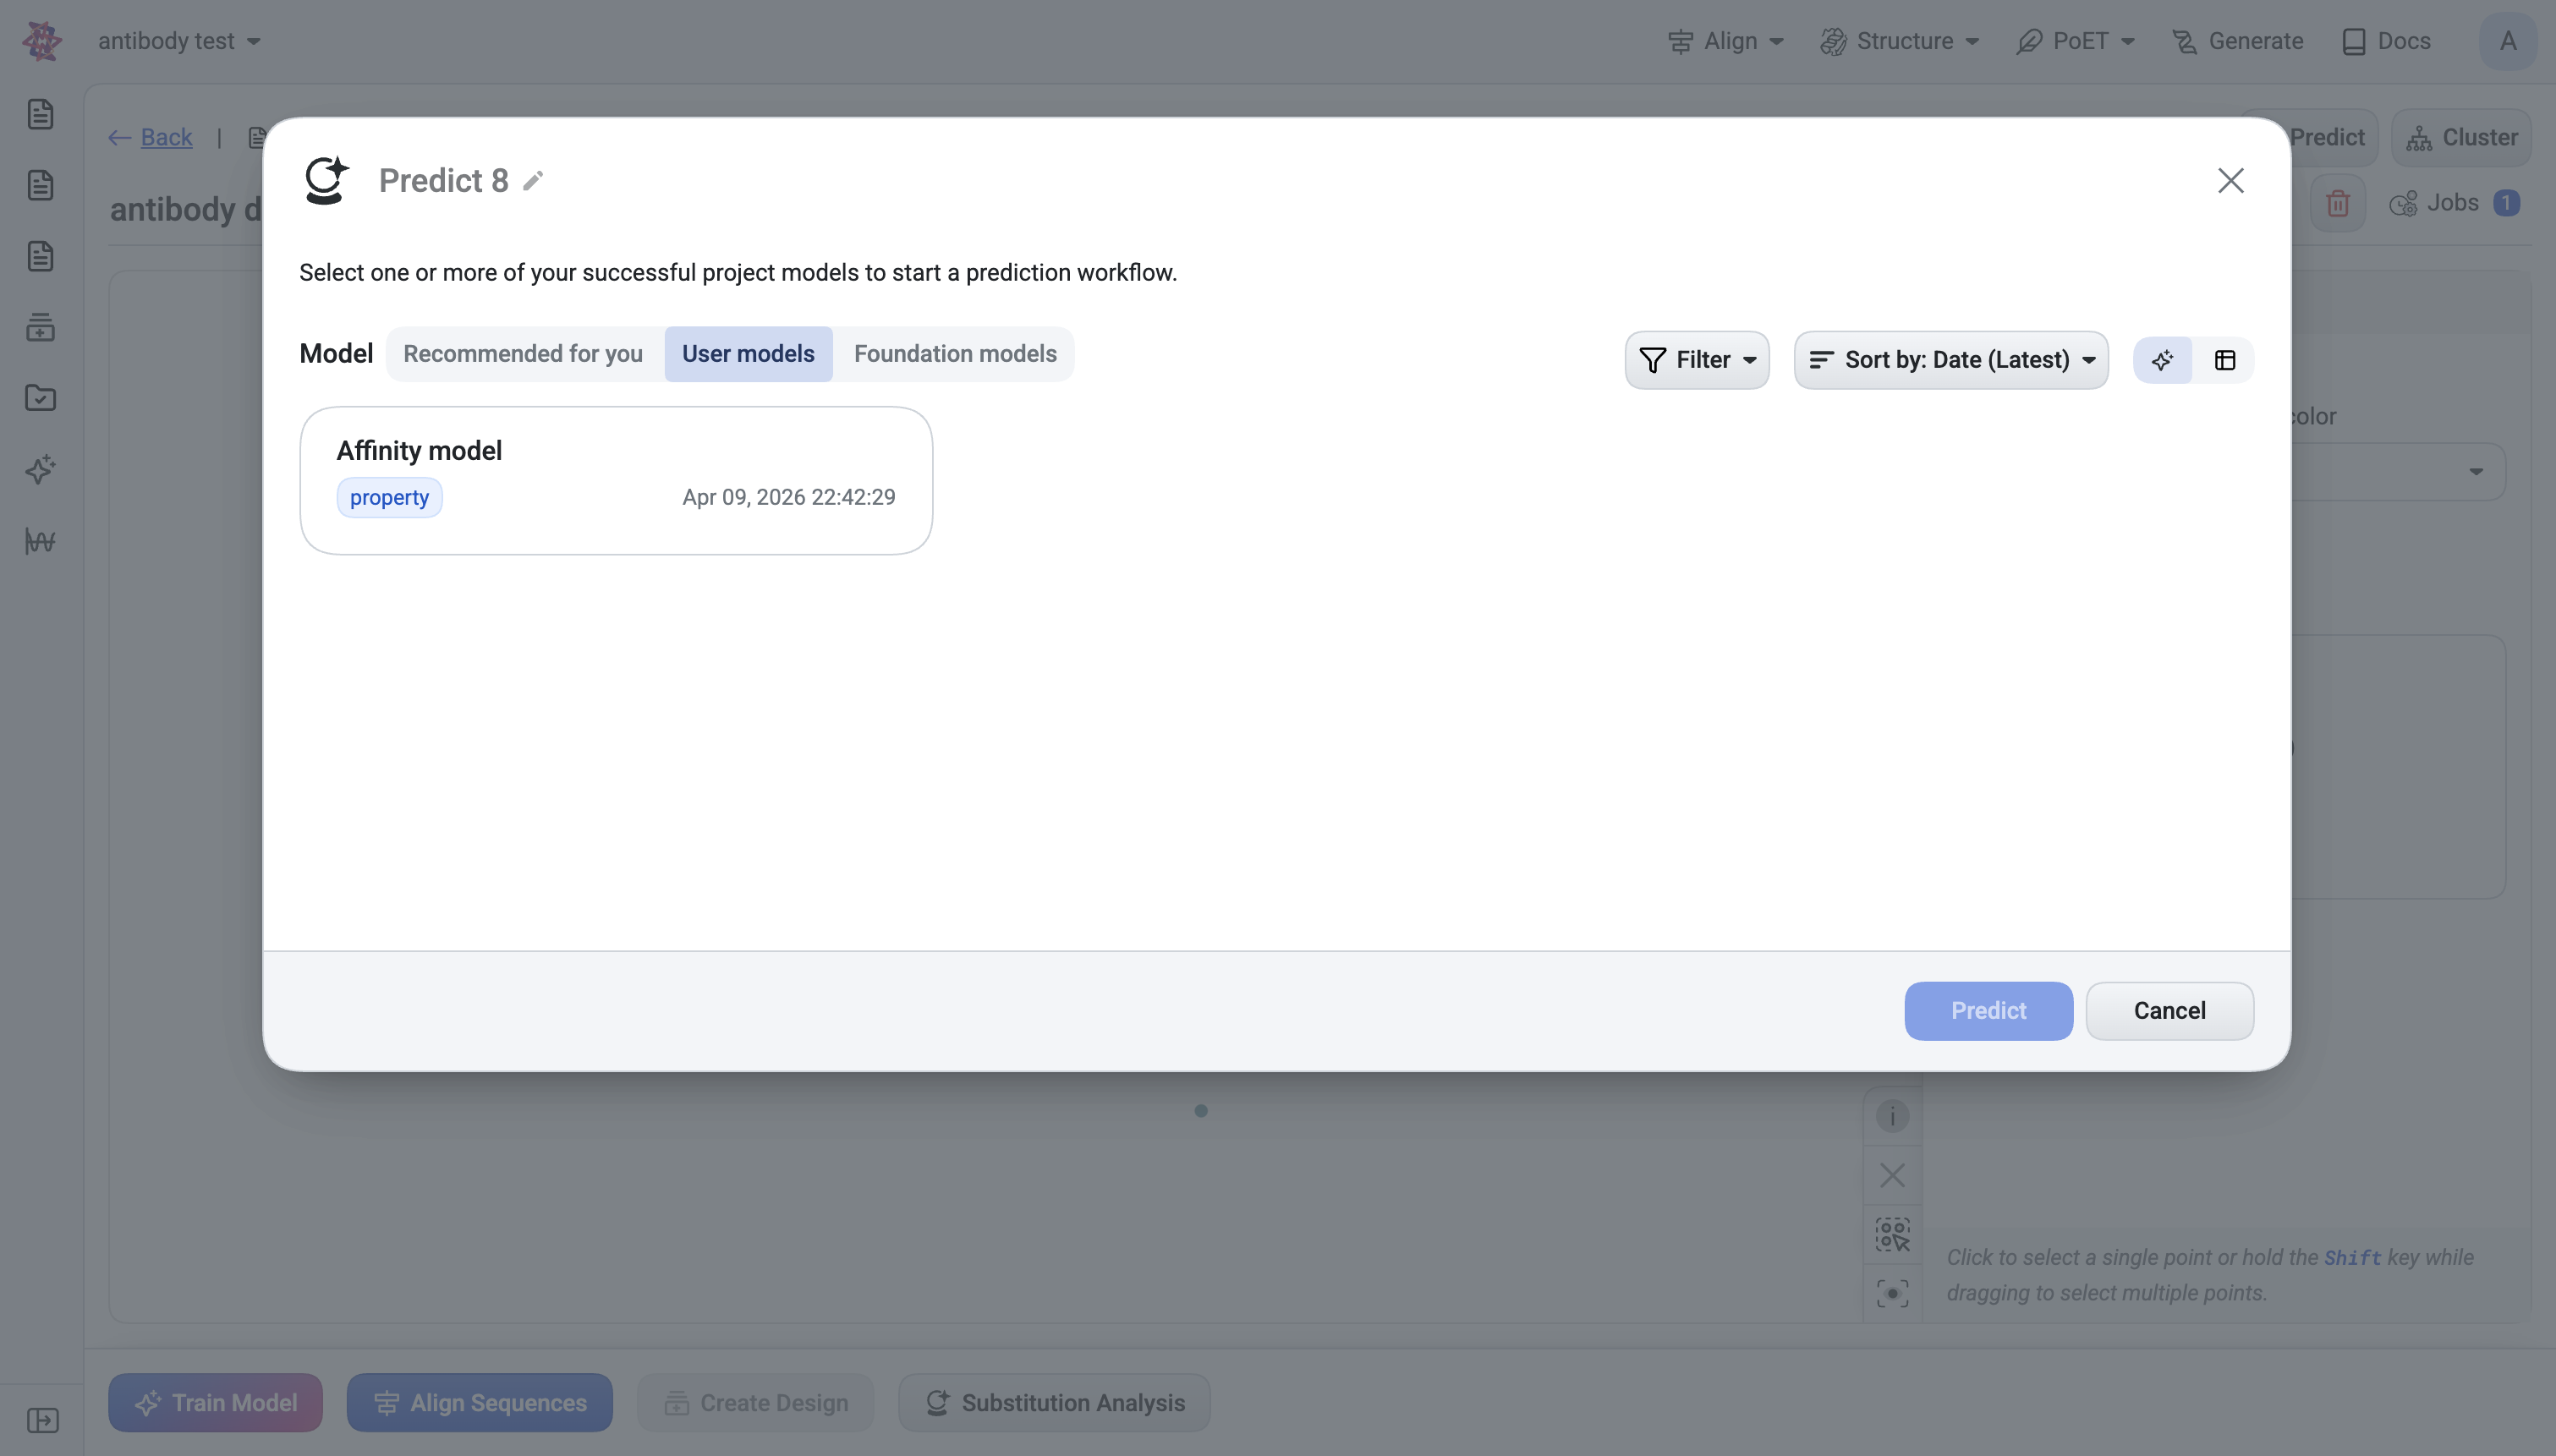
User models — your own trained models, filterable by training dataset, embedding model, reduction type, and target property.
Foundation models — PoET-2, ESM2, ESM1b, ProtT5, etc.
Prompt (PoET / PoET-2 only) — a set of context sequences that condition the score. You can create a new prompt or pick an existing one.
Models can be selected one or many at a time.
What happens after submit#
A job is queued (visible in the Jobs panel; badge counter on the Jobs button).
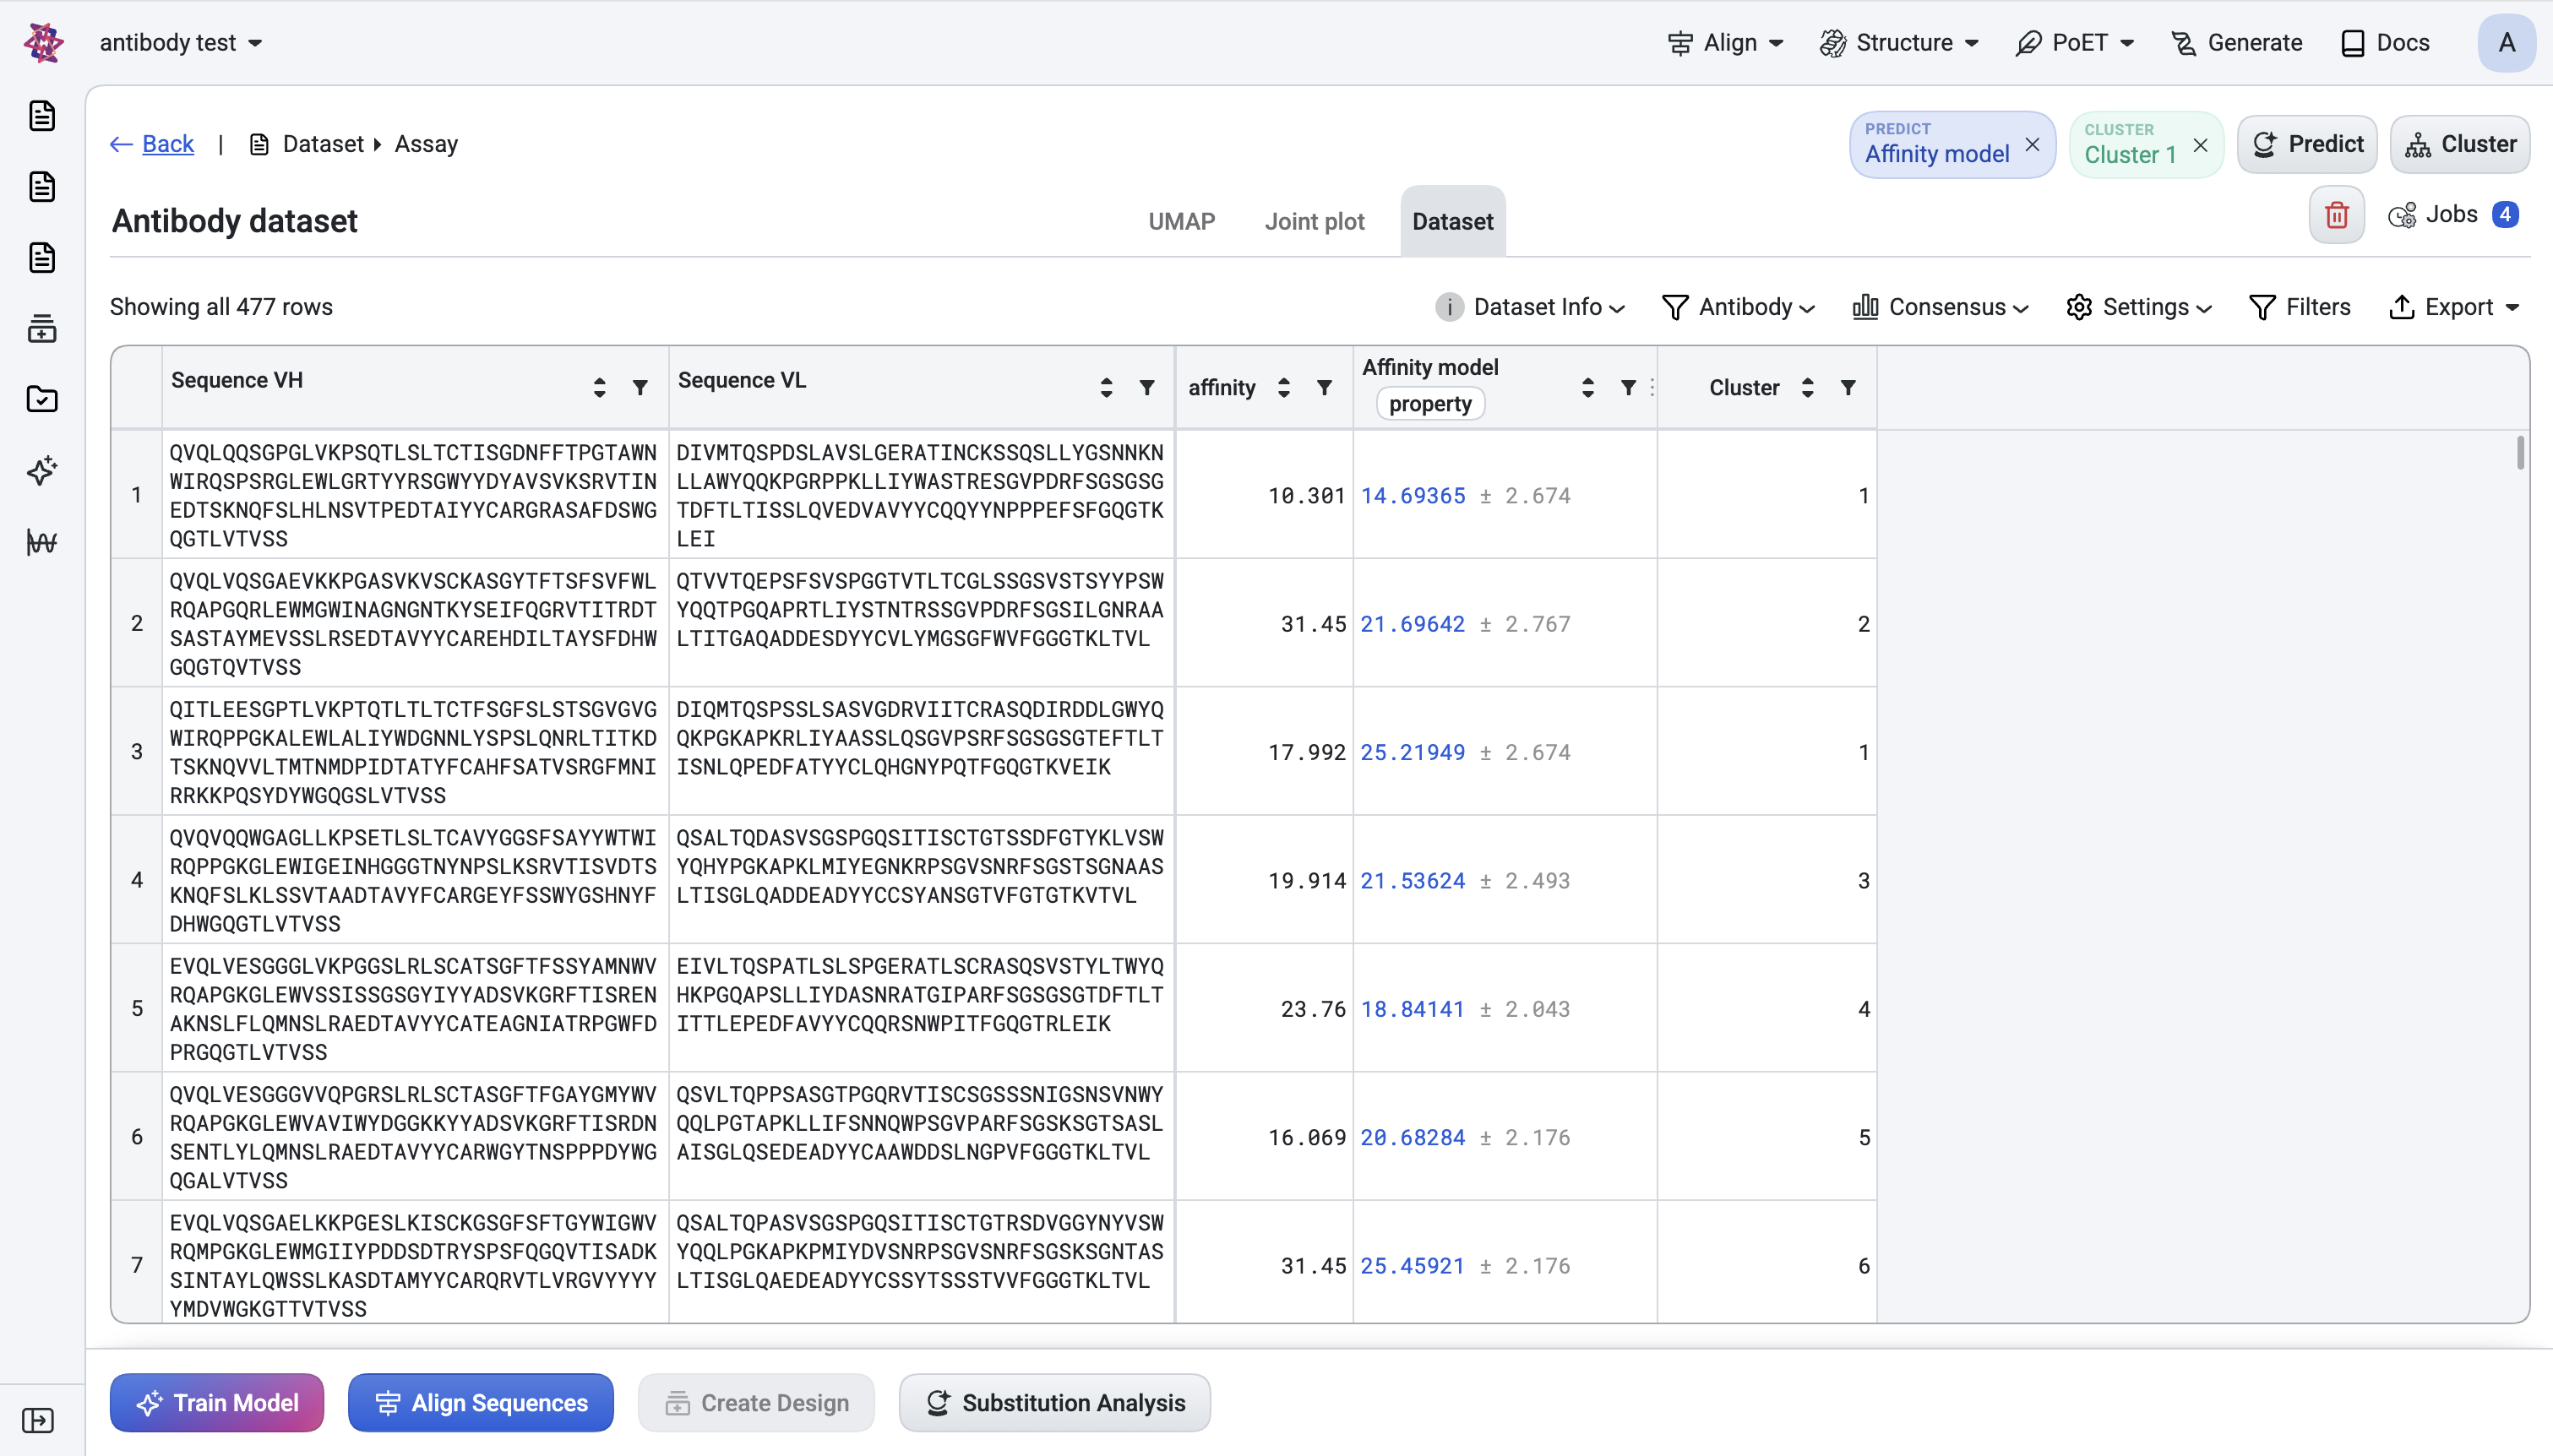
When complete, a Predict bubble chip appears in the header showing the model name (and prompt name if applicable). Click the × to remove.
A new column is added to the Dataset table.
The prediction’s mean-score becomes available as an axis option on the UMAP and Joint plot tabs.
2. Clustering#
Purpose: Group sequences into distinct families using advanced sequence embeddings, enabling you to select diverse representatives from each cluster family rather than redundant near-duplicates.
How to open#
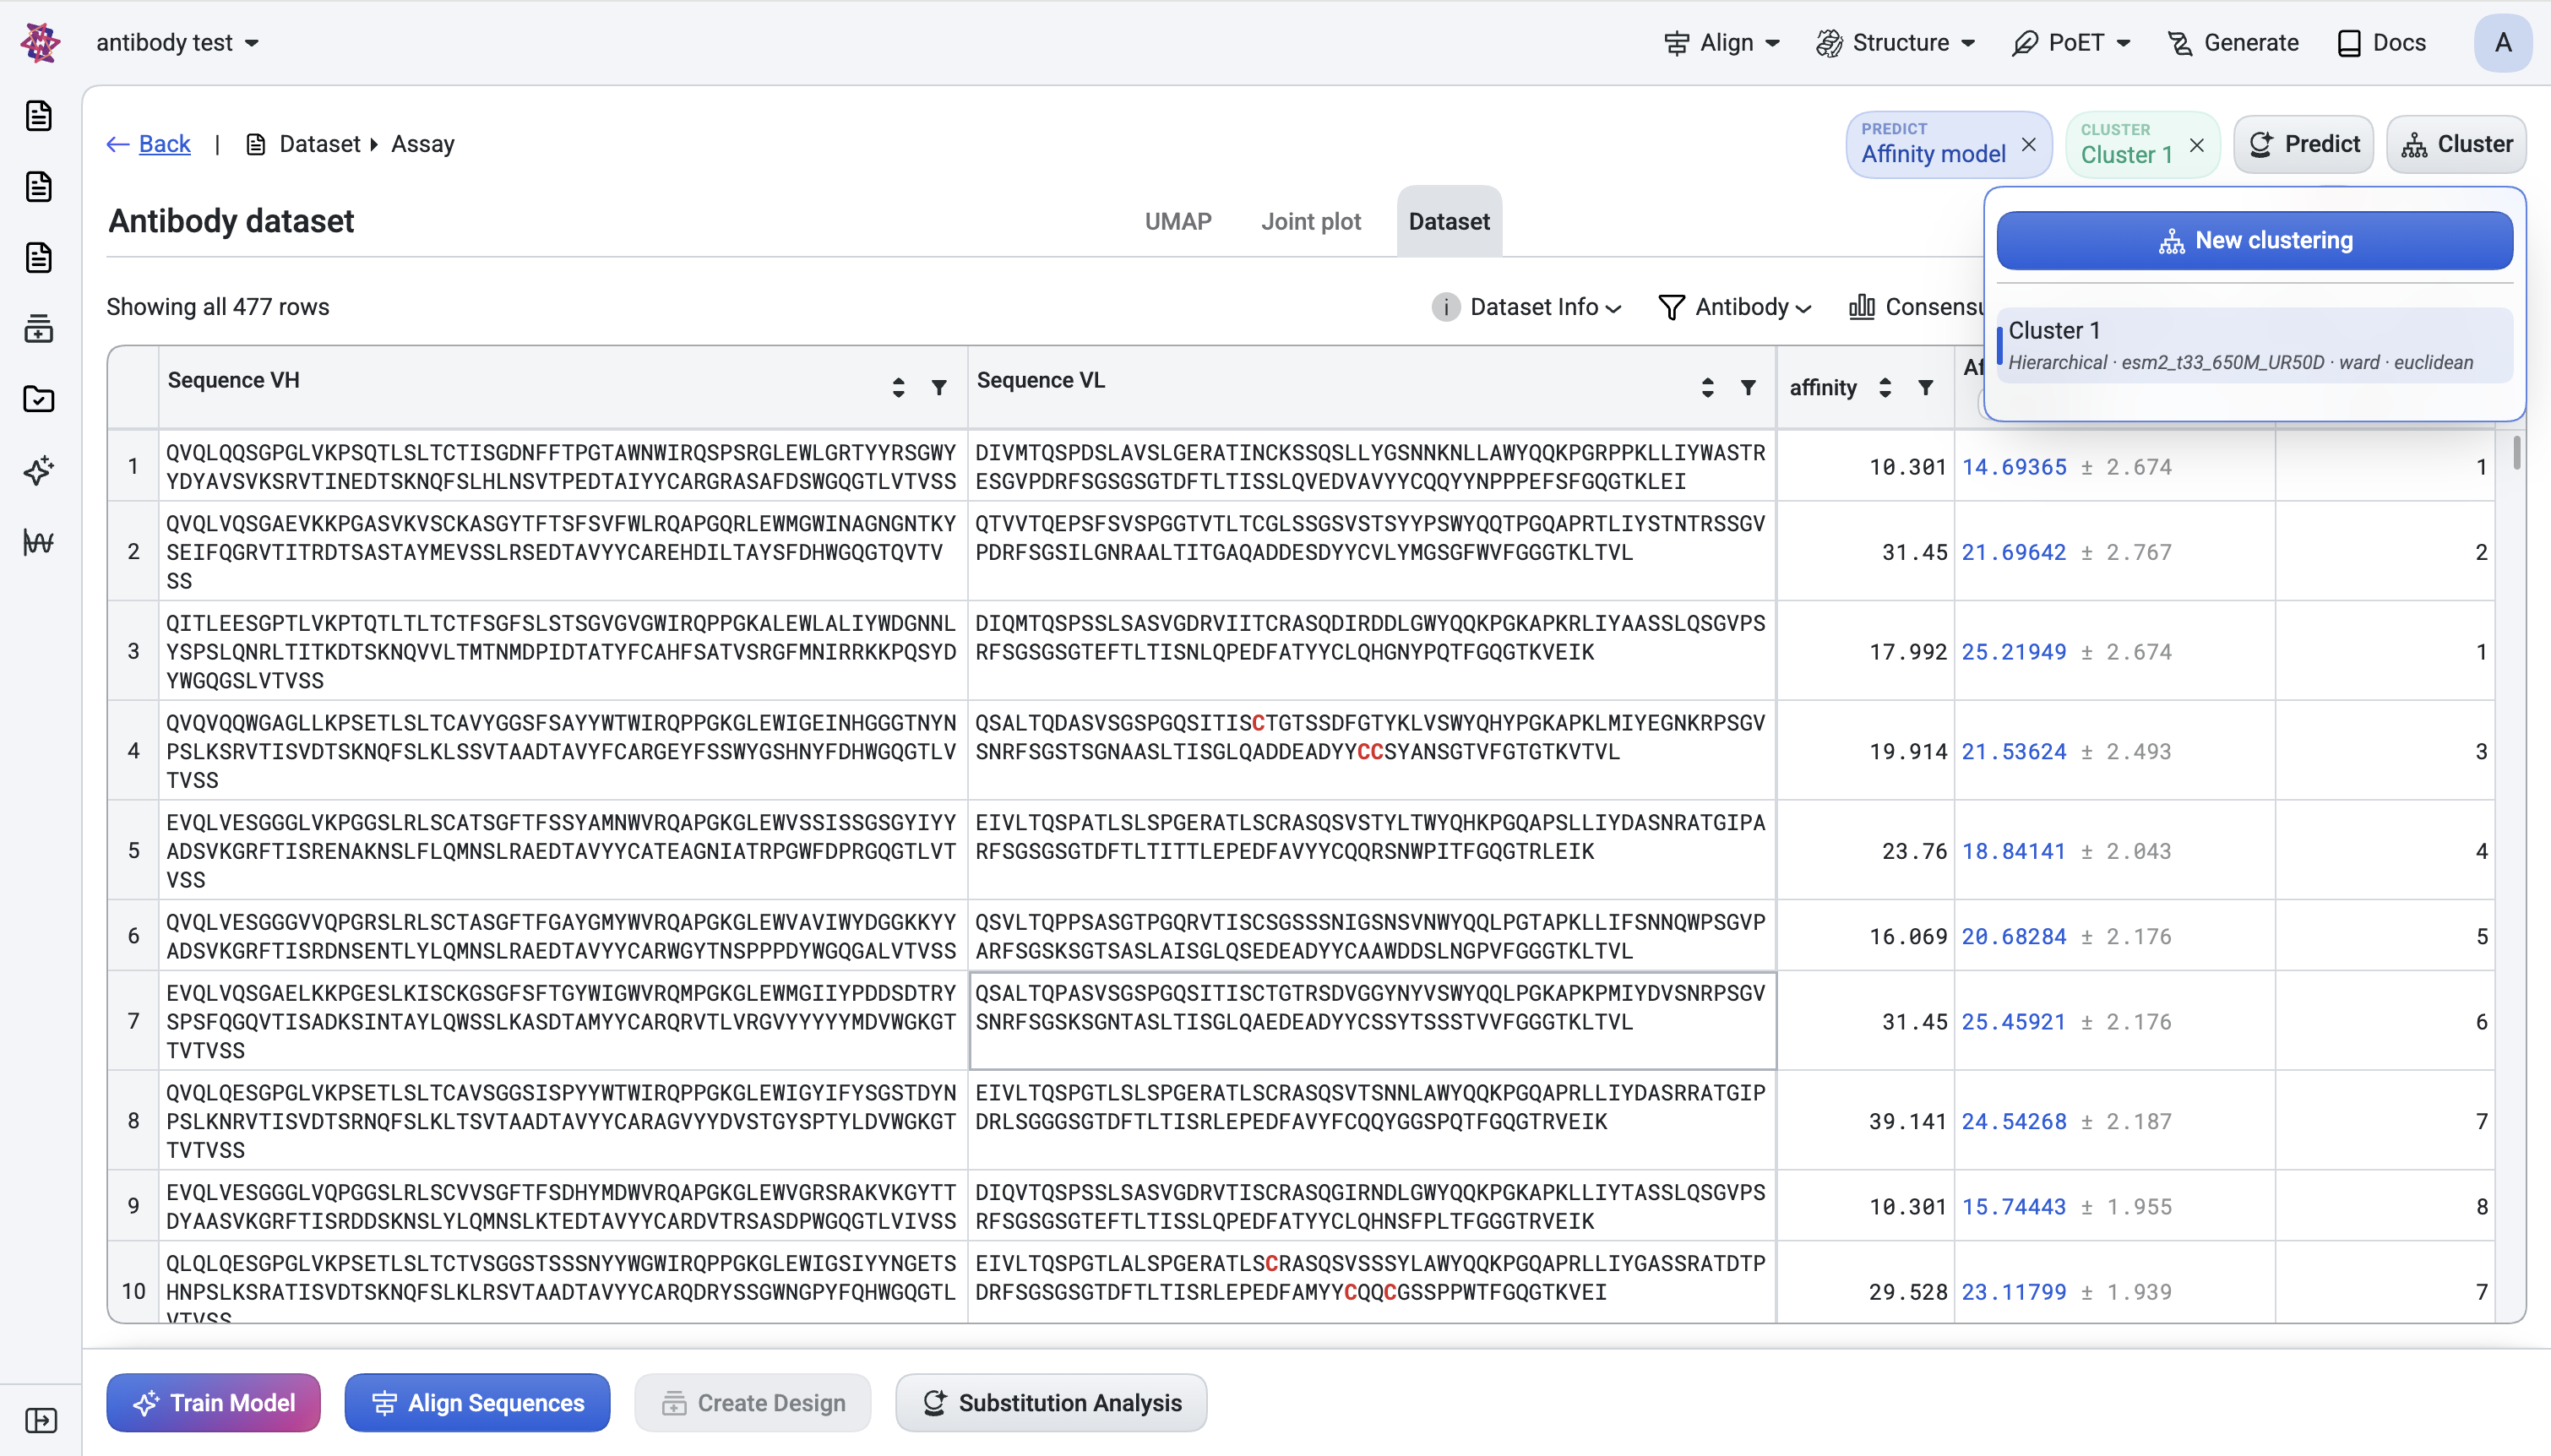
Click Cluster in the header → New clustering.
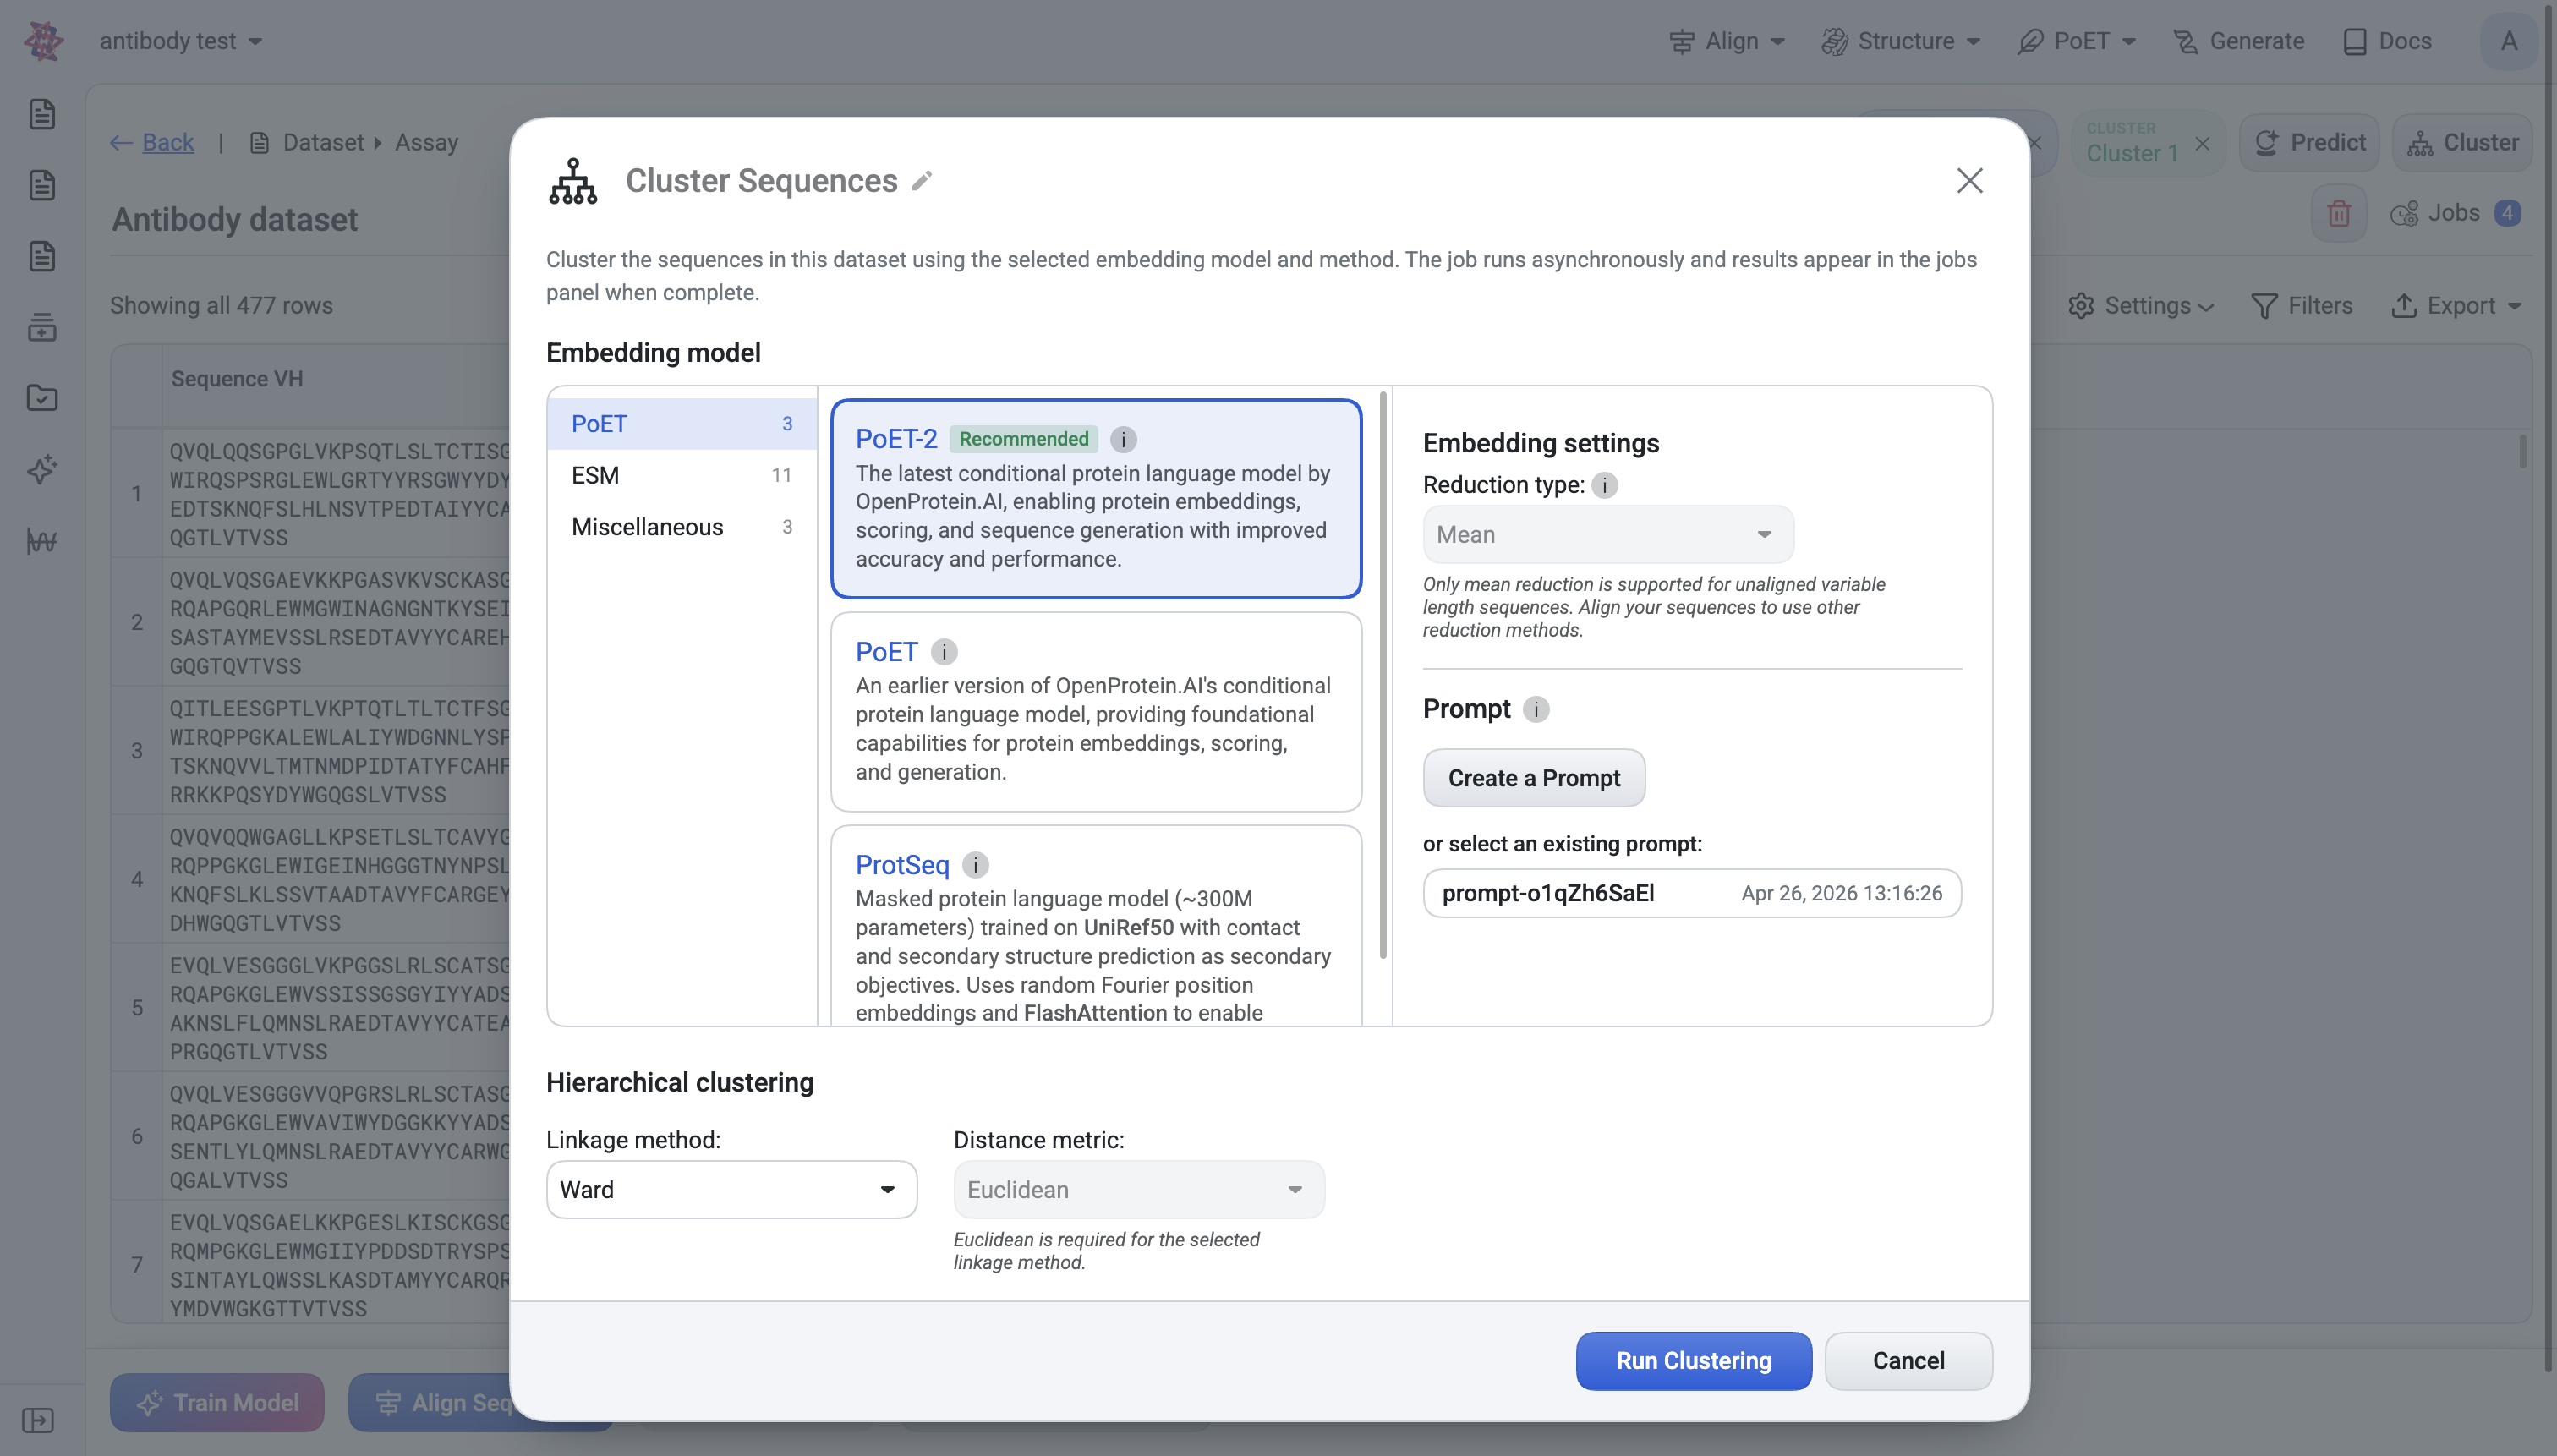
What you choose#
Embedding model — PoET-2 (recommended), ESM2, ESM1b, ProtT5, RotaProt, etc. Chain-aware models are required if your sequences contain a
:chain separator (e.g. heavy:light).Reduction type — None, Mean, or Sum. Variable-length unaligned sequences force Mean.
Prompt (PoET only) — same prompt mechanism as Predict.
Linkage method — Ward (default), Single, Complete.
Distance metric — Euclidean (default) or Cosine. Ward requires Euclidean.
What happens after submit#
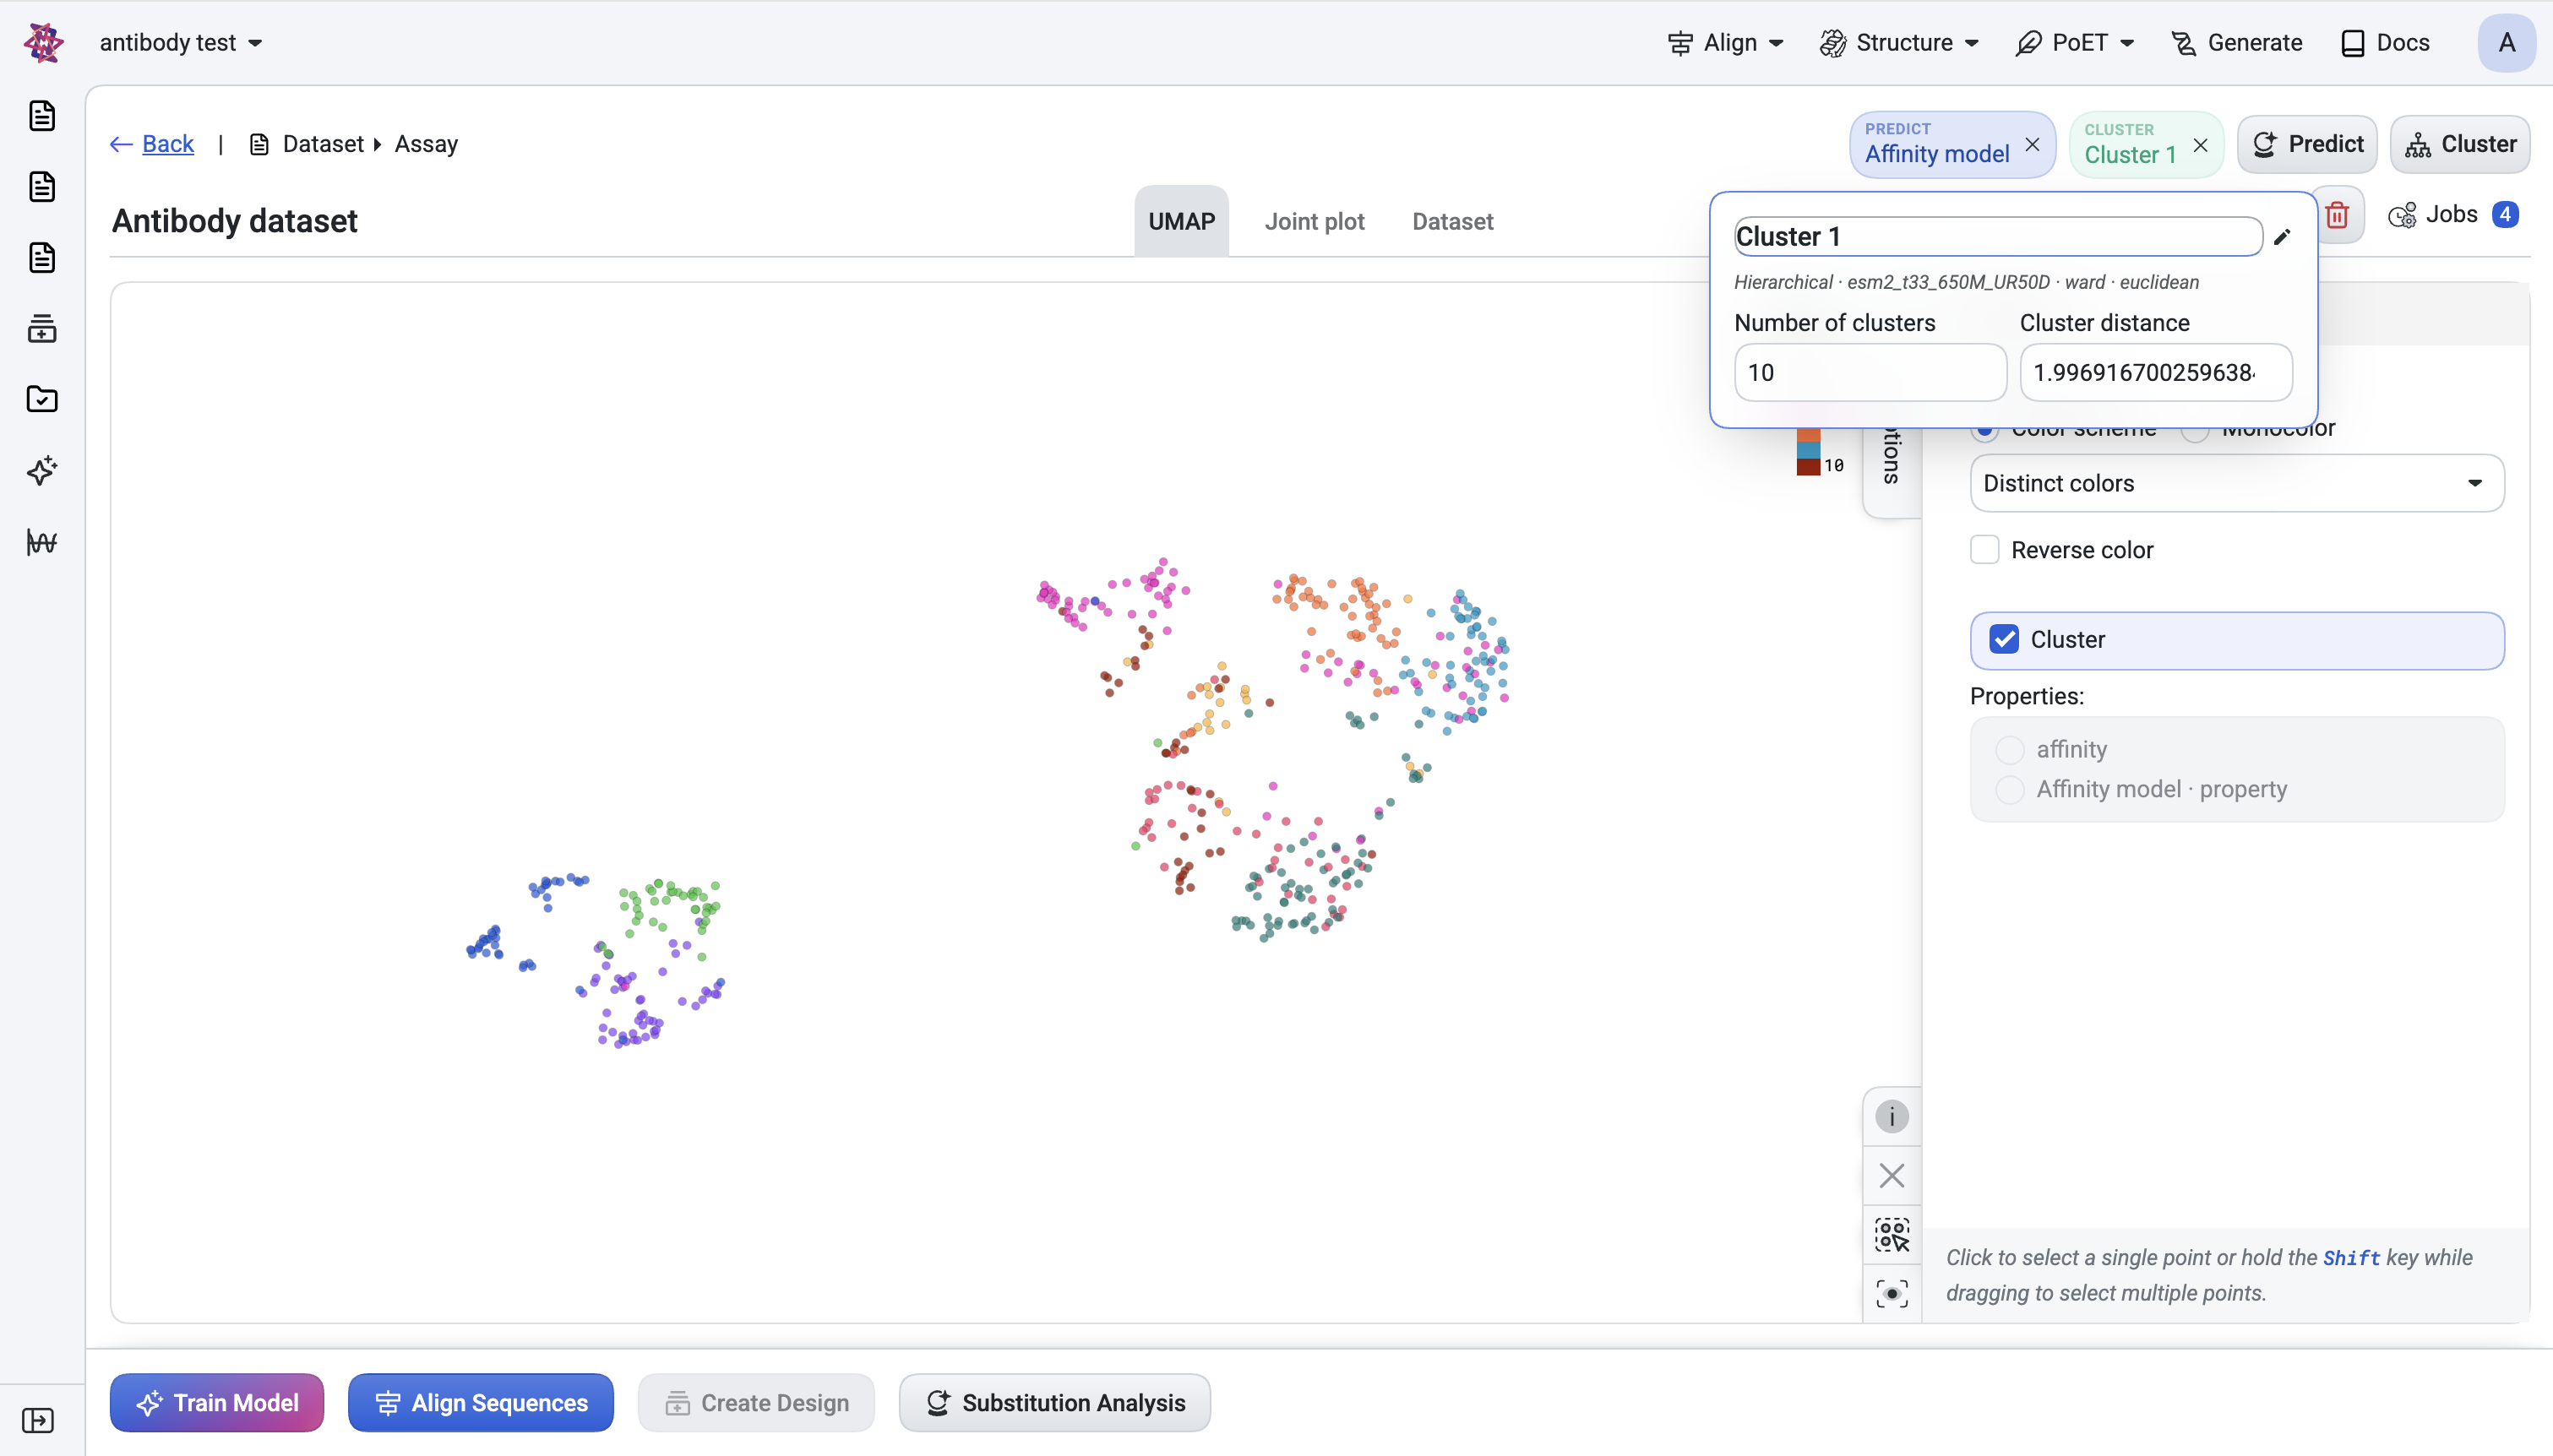
A Cluster bubble chip appears in the header. The chip is interactive — click it to adjust the cut on the dendrogram in two ways:
Number of clusters — set how many clusters to produce.
Cluster distance — set a distance threshold instead.
A
Cluster Numbercolumn is added to the Dataset table.Cluster assignments colour the UMAP points so you can see family structure visually.
3. Advanced Filters#
Purpose: Refine your dataset using flexible multi-criteria filtering, combine any column values, group by specific properties, sort by priority metrics, and retain only top-K candidates. Choose between hiding non-matching rows for a clean view or marking them in a Select column to preserve full context while highlighting your refined selection.
How to open#
From the Dataset tab toolbar. The panel docks on the right.
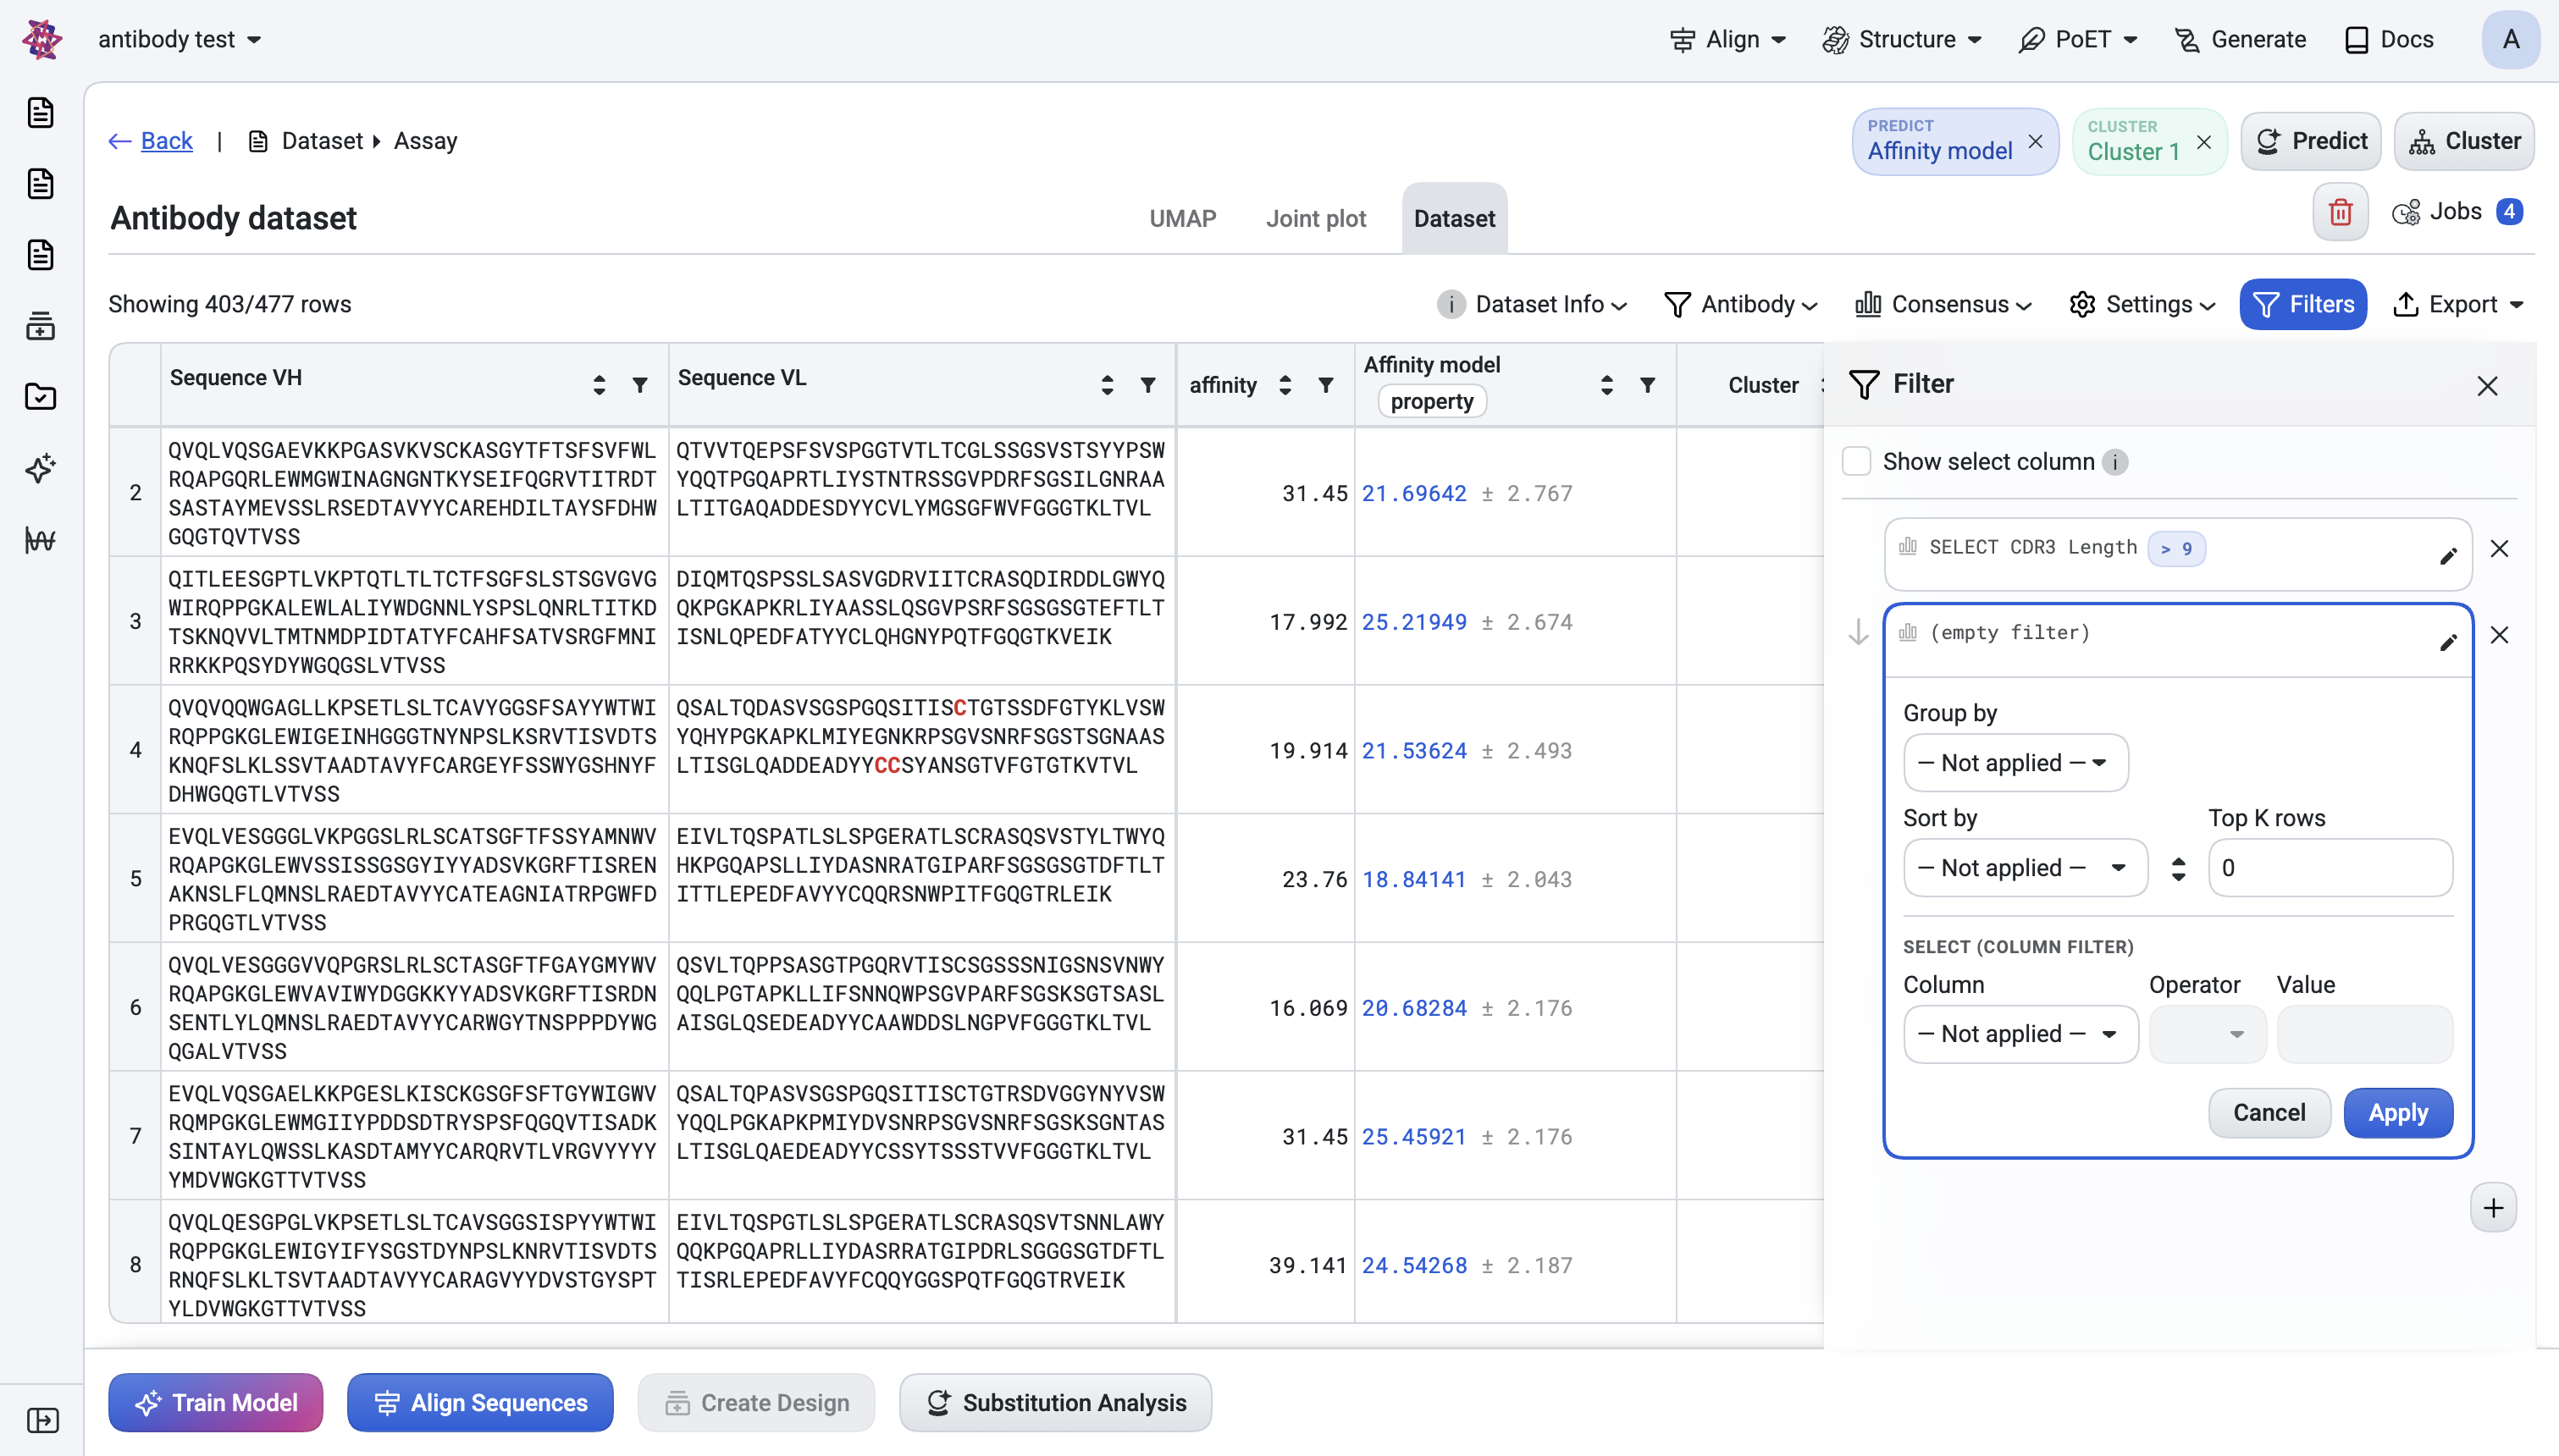
Panel-level option#
Show select column — instead of hiding non-matching rows, add a Y/N column to the table. Useful when you want to see what got rejected before exporting.
What each filter card can do#
Sections are independent and stackable:
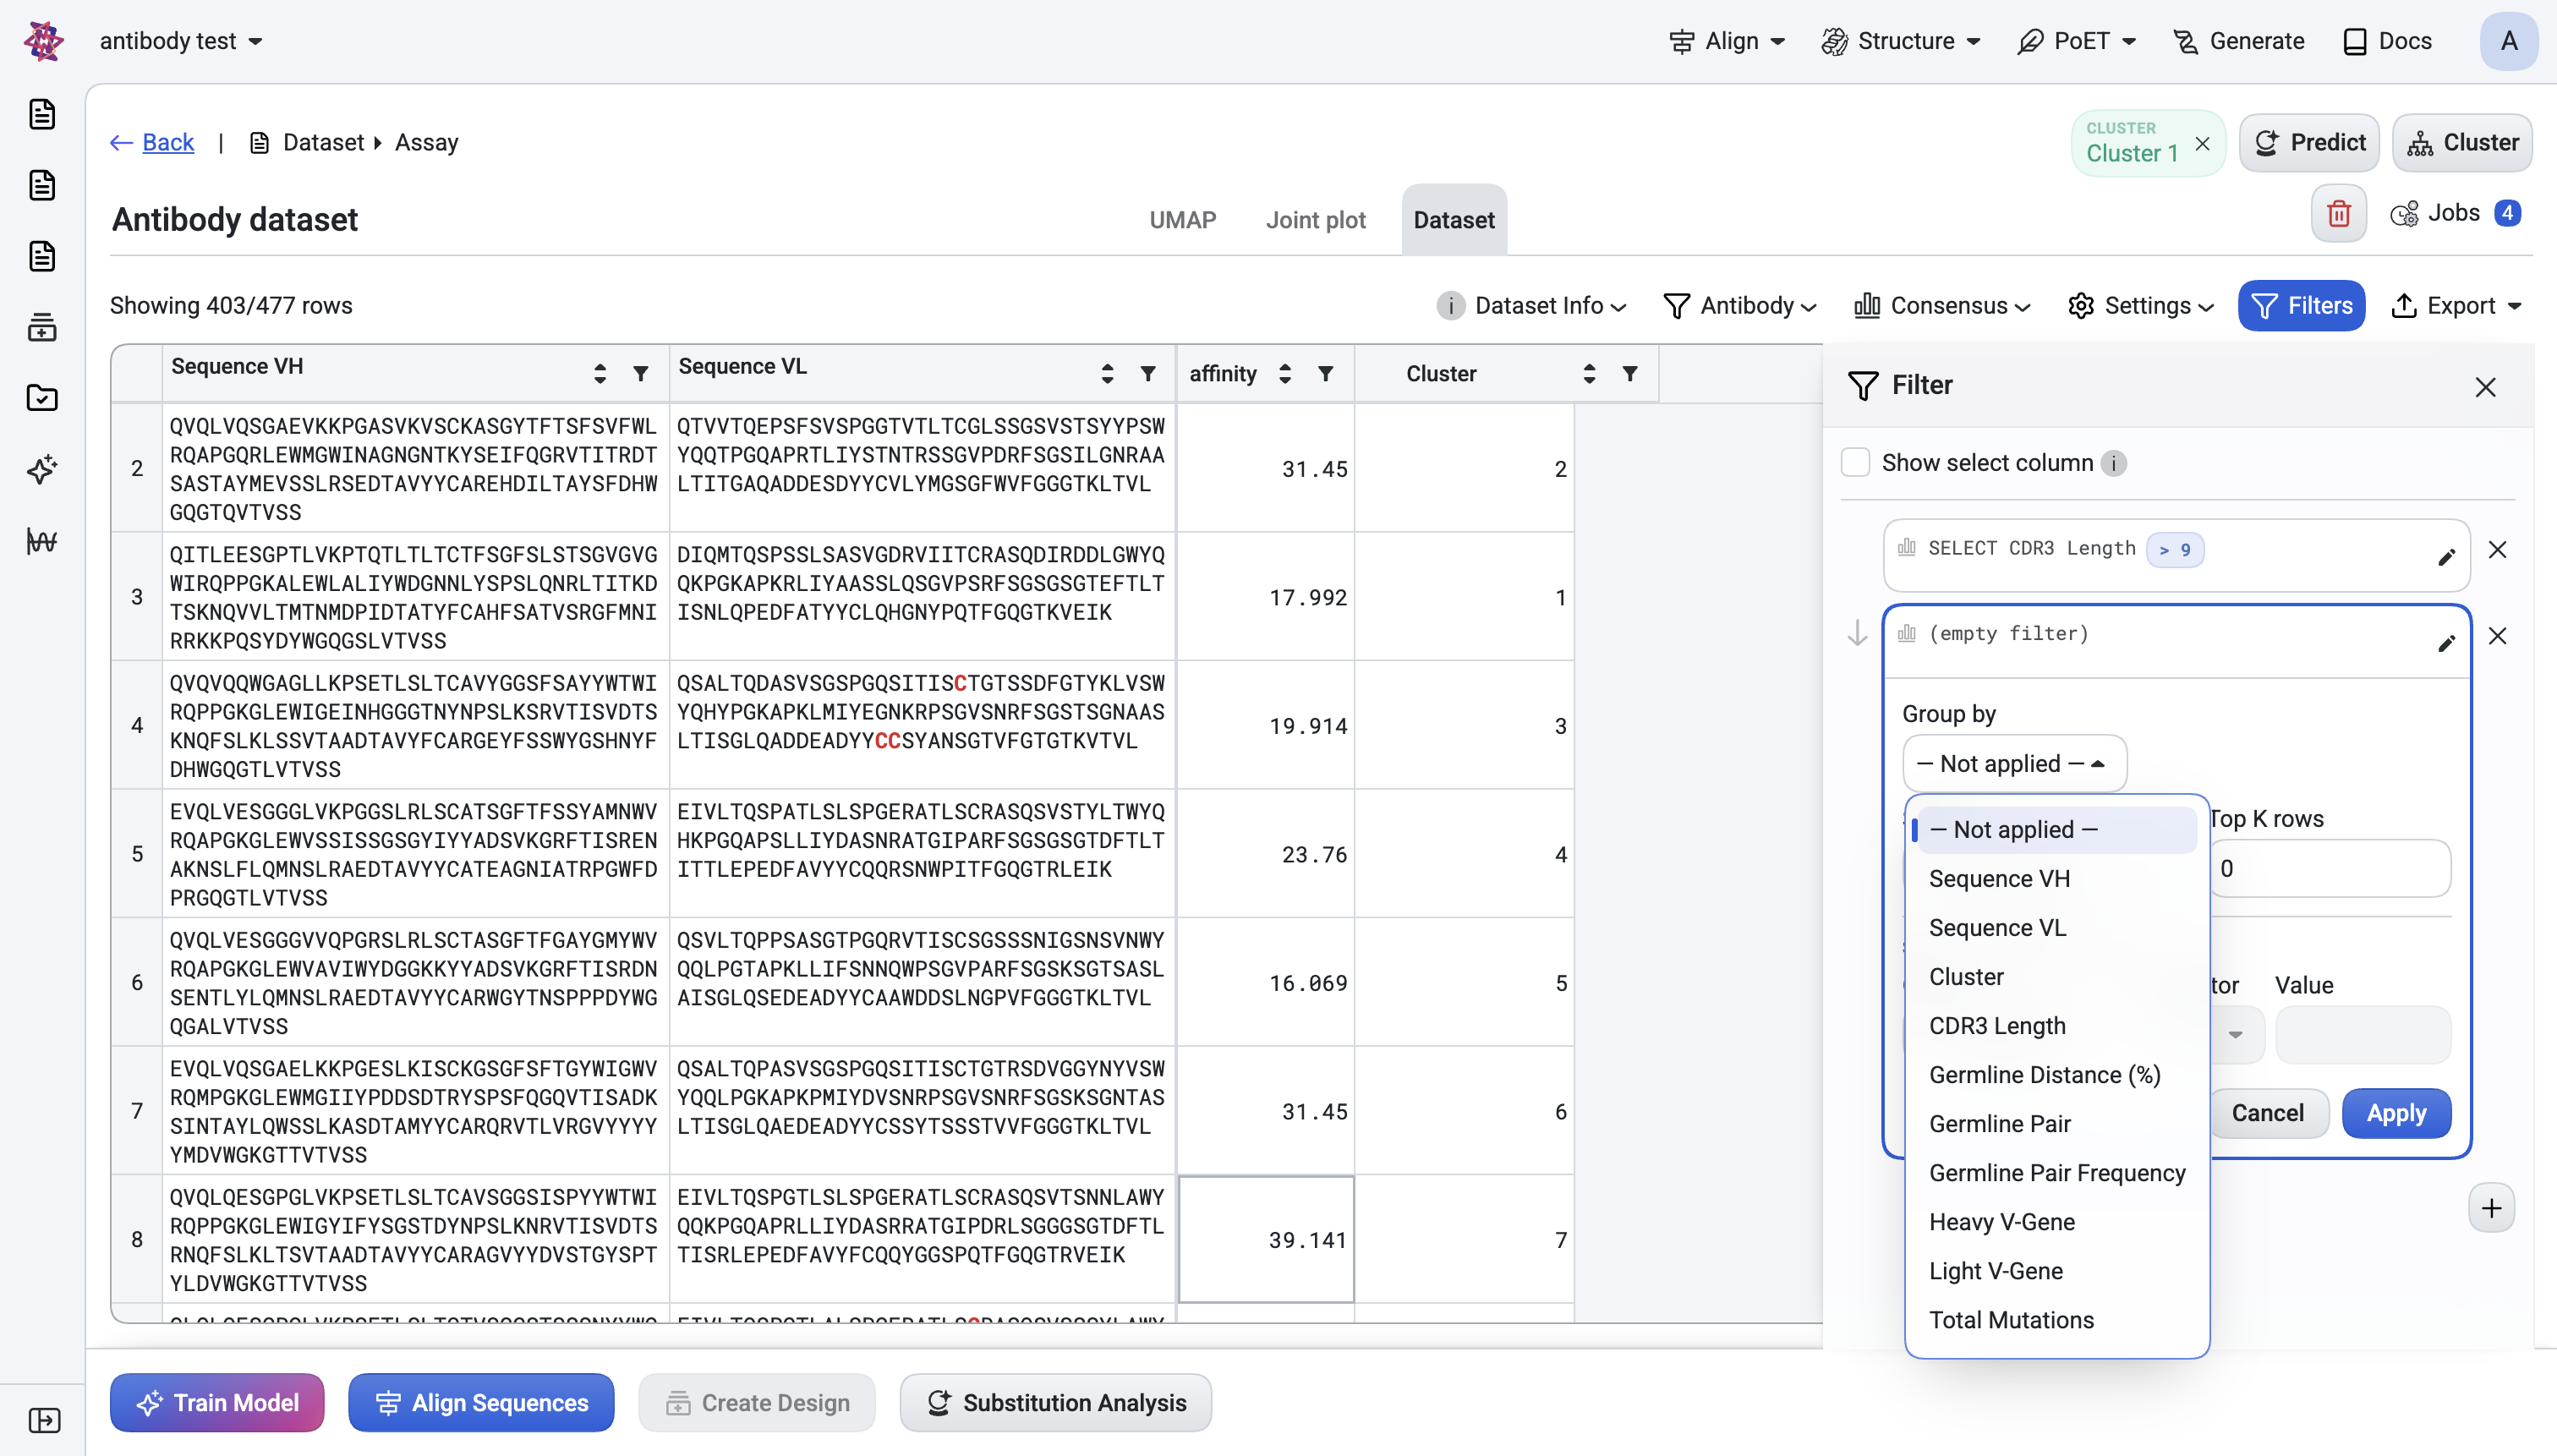
Group by a column (integer or text columns only).
Sort by a column, ascending or descending.
Top K rows — keep only the best K (or top-K per group when Group by is set).
Column filter — pick a column, an operator, and a value:
Numeric columns:
=,!=,>,>=,<,<=.Text columns:
=,!=,contain,start_with,end_with.
Filter cards can be reordered (drag-and-drop), edited, or deleted.
Antibody-aware columns#
When your dataset is detected as antibody data, specialized antibody annotation columns automatically become available as filtering, grouping, and sorting options. For the complete list of available columns, see d. Show antibody columns.
Cross-feature interactions#
Once a clustering is active,
Cluster Numbershows up as a filterable column — you can isolate one cluster at a time.Once a prediction is active, its score column shows up as a filterable column — you can keep only rows above a score threshold.
Filters propagate to plots: hidden rows are dimmed in the UMAP and Joint plot, and selected rows are highlighted.
4. Antibody Settings Panel#
Purpose: Customize the visual presentation of antibody sequences by configuring numbering schemes, alignment settings, and CDR region highlighting, while selecting which annotation columns to display in your analysis table.
Note
Antibody-specific visualisation lives inside the Dataset tab as a settings panel that appears automatically when the dataset is detected as antibody data.
How to open#
On the Dataset tab, click the Antibody action in the table header. The “Antibody Settings” panel expands.
The panel has five sections, side-by-side.
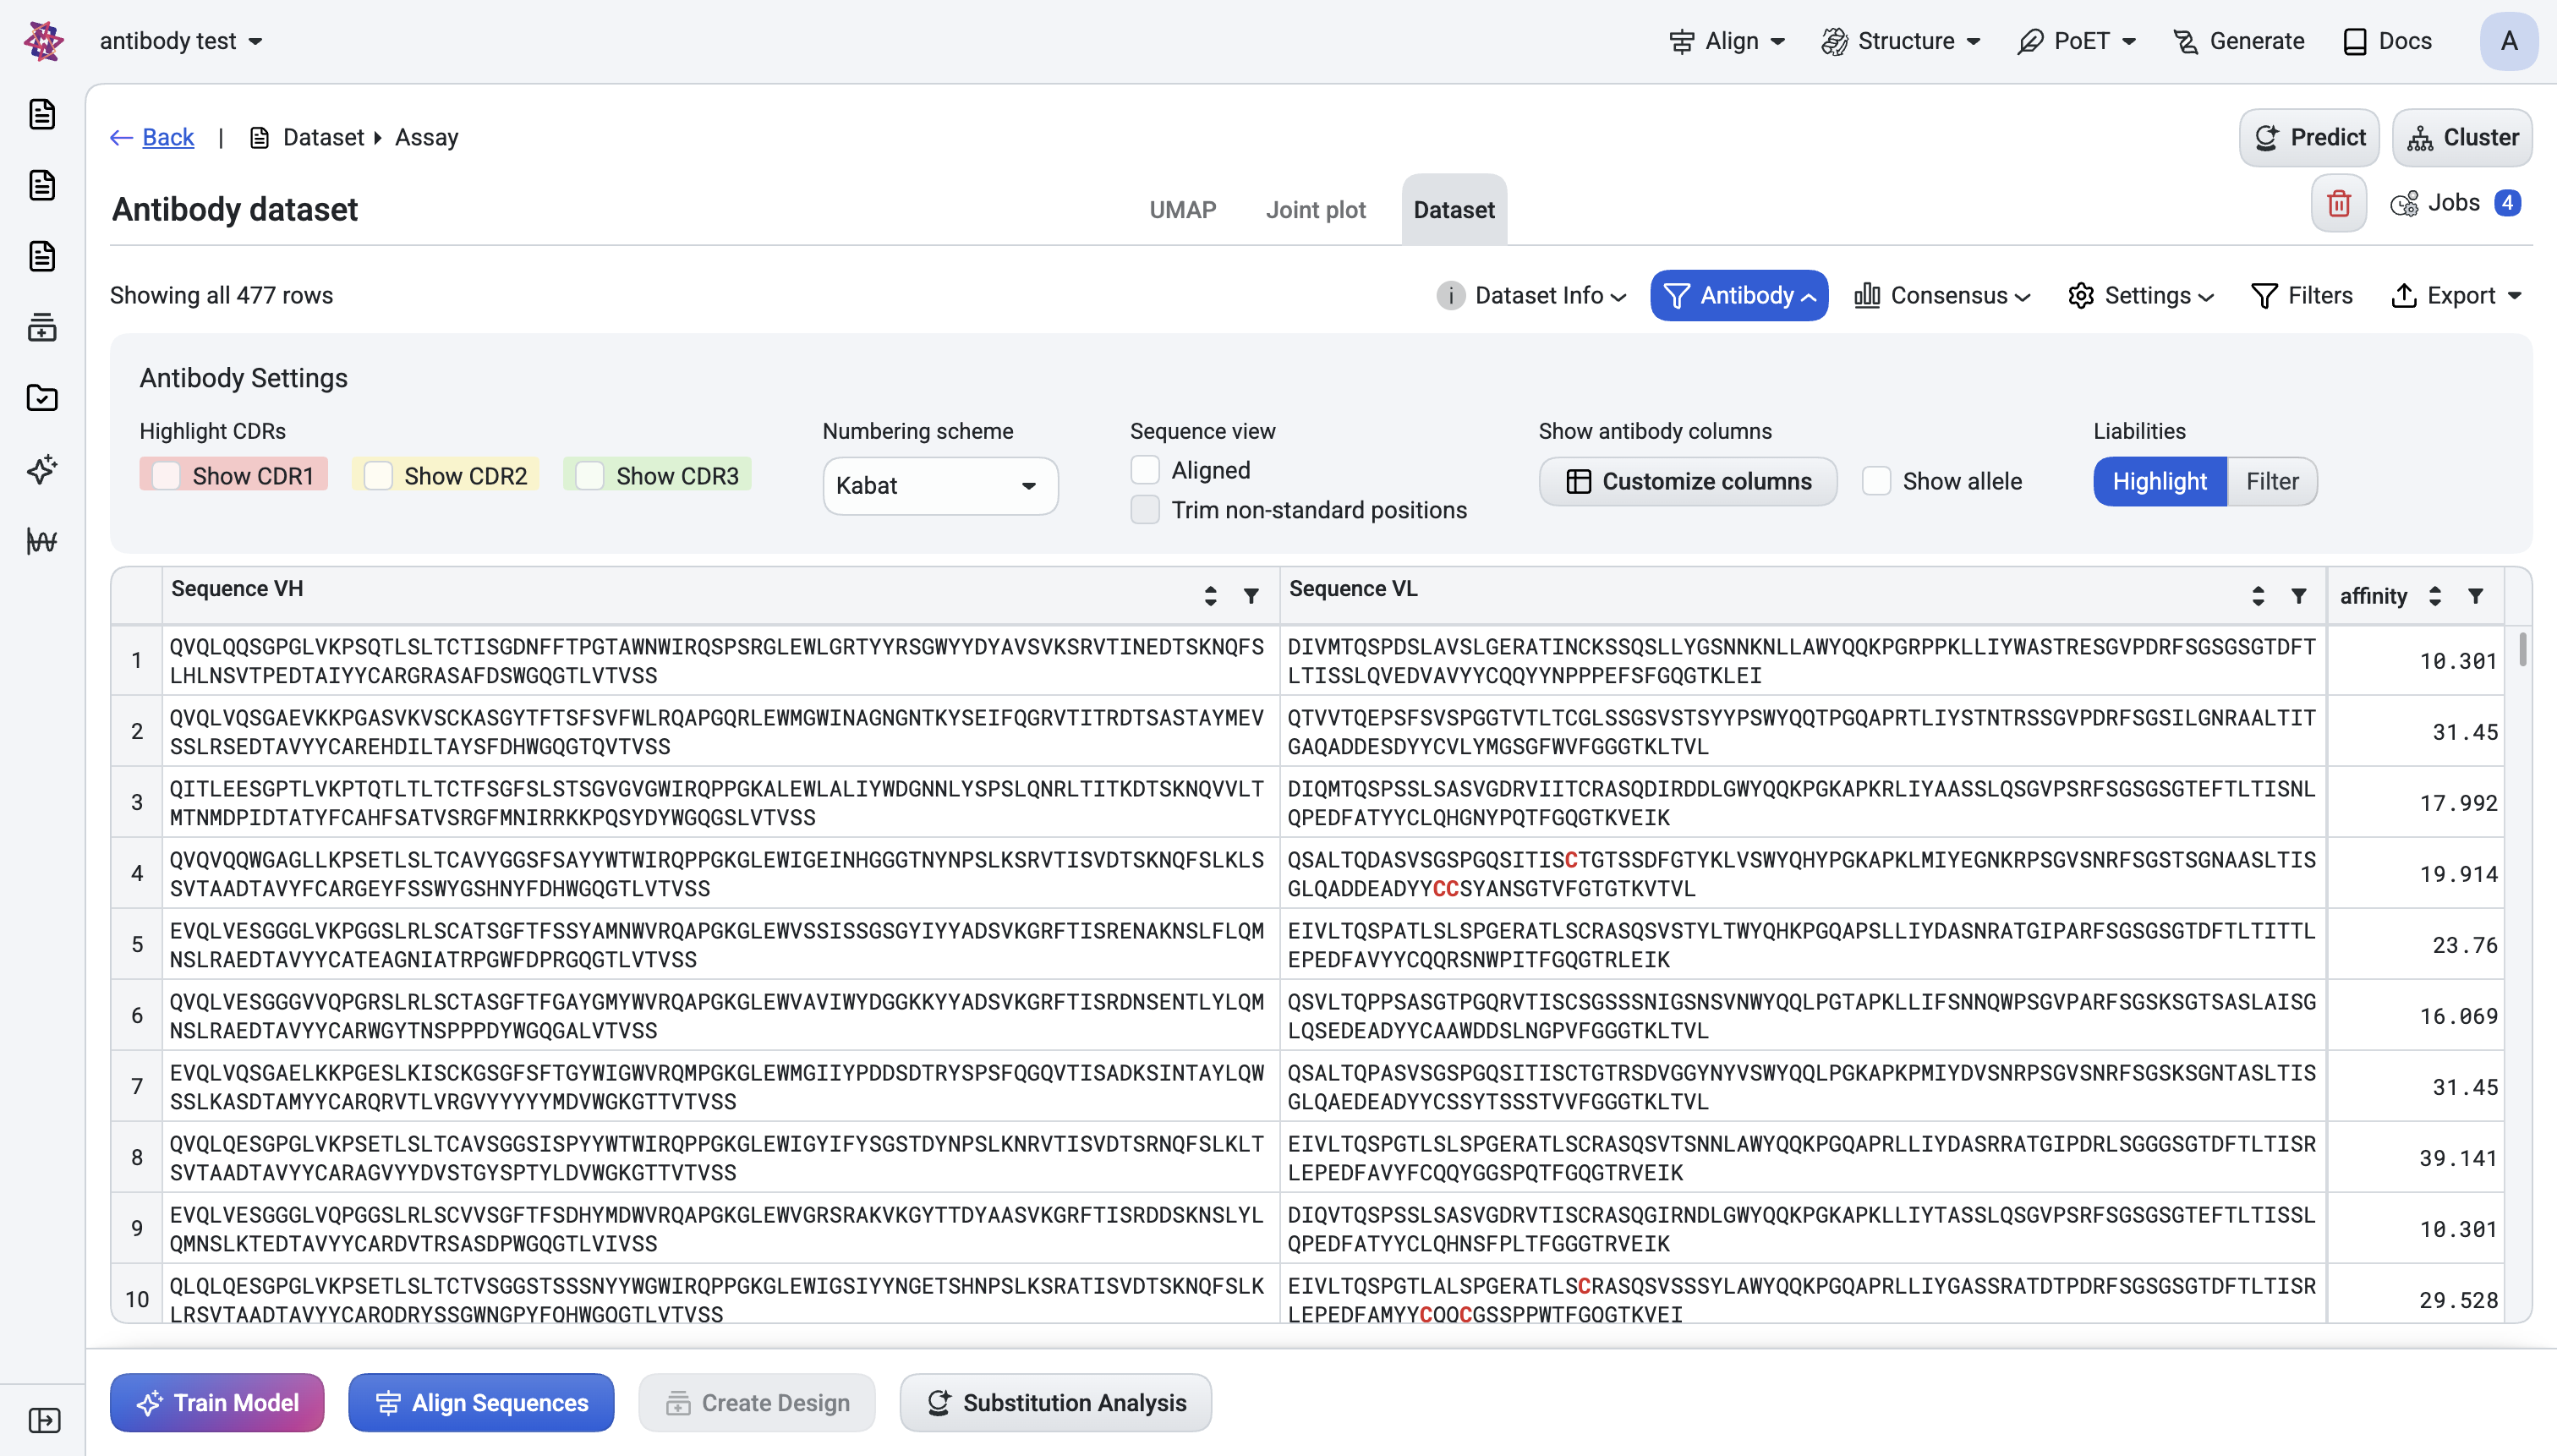
a. Highlight CDRs#
Three colour-coded checkboxes:
Show CDR1 (red)
Show CDR2 (yellow)
Show CDR3 (green)
Each highlights its region in the sequence column with a coloured background. Works in both raw and aligned views.
b. Numbering scheme#
A dropdown with two options: Kabat (default) or IMGT. Selecting a scheme:
Recomputes the CDR boundaries used by the highlight checkboxes above.
Updates the aligned-sequence column header to show the active scheme (e.g. “Aligned VH (KABAT)” or “Aligned VH (IMGT)”).
Schemes are cached, so switching back is instant after the first load.
Tip
Picking a numbering scheme. Use Kabat if you need to compare against legacy datasets or papers using Kabat. Use IMGT for modern repertoire/NGS work, since IMGT is the standard for germline-database comparisons and most NGS annotation pipelines (e.g. IgBLAST, MiXCR) report IMGT-style positions natively. The CDR boundaries (and therefore the highlighting and CDR3-length value) differ between schemes — set this before you start filtering by CDR3 Length so the values are consistent with what you expect.
c. Sequence view#
Aligned — replaces the raw sequence column with two aligned columns (VH and VL), padded with gaps so every row is the same length. Required for downstream visualisations that assume aligned coordinates (conservation, liabilities, position-based selection).
Trim non-standard positions — only available when Aligned is on. Strips positions outside the standard variable domain (H0, H129+, L0, L129+). Unchecked: those residues are shown in lowercase with reduced opacity instead.
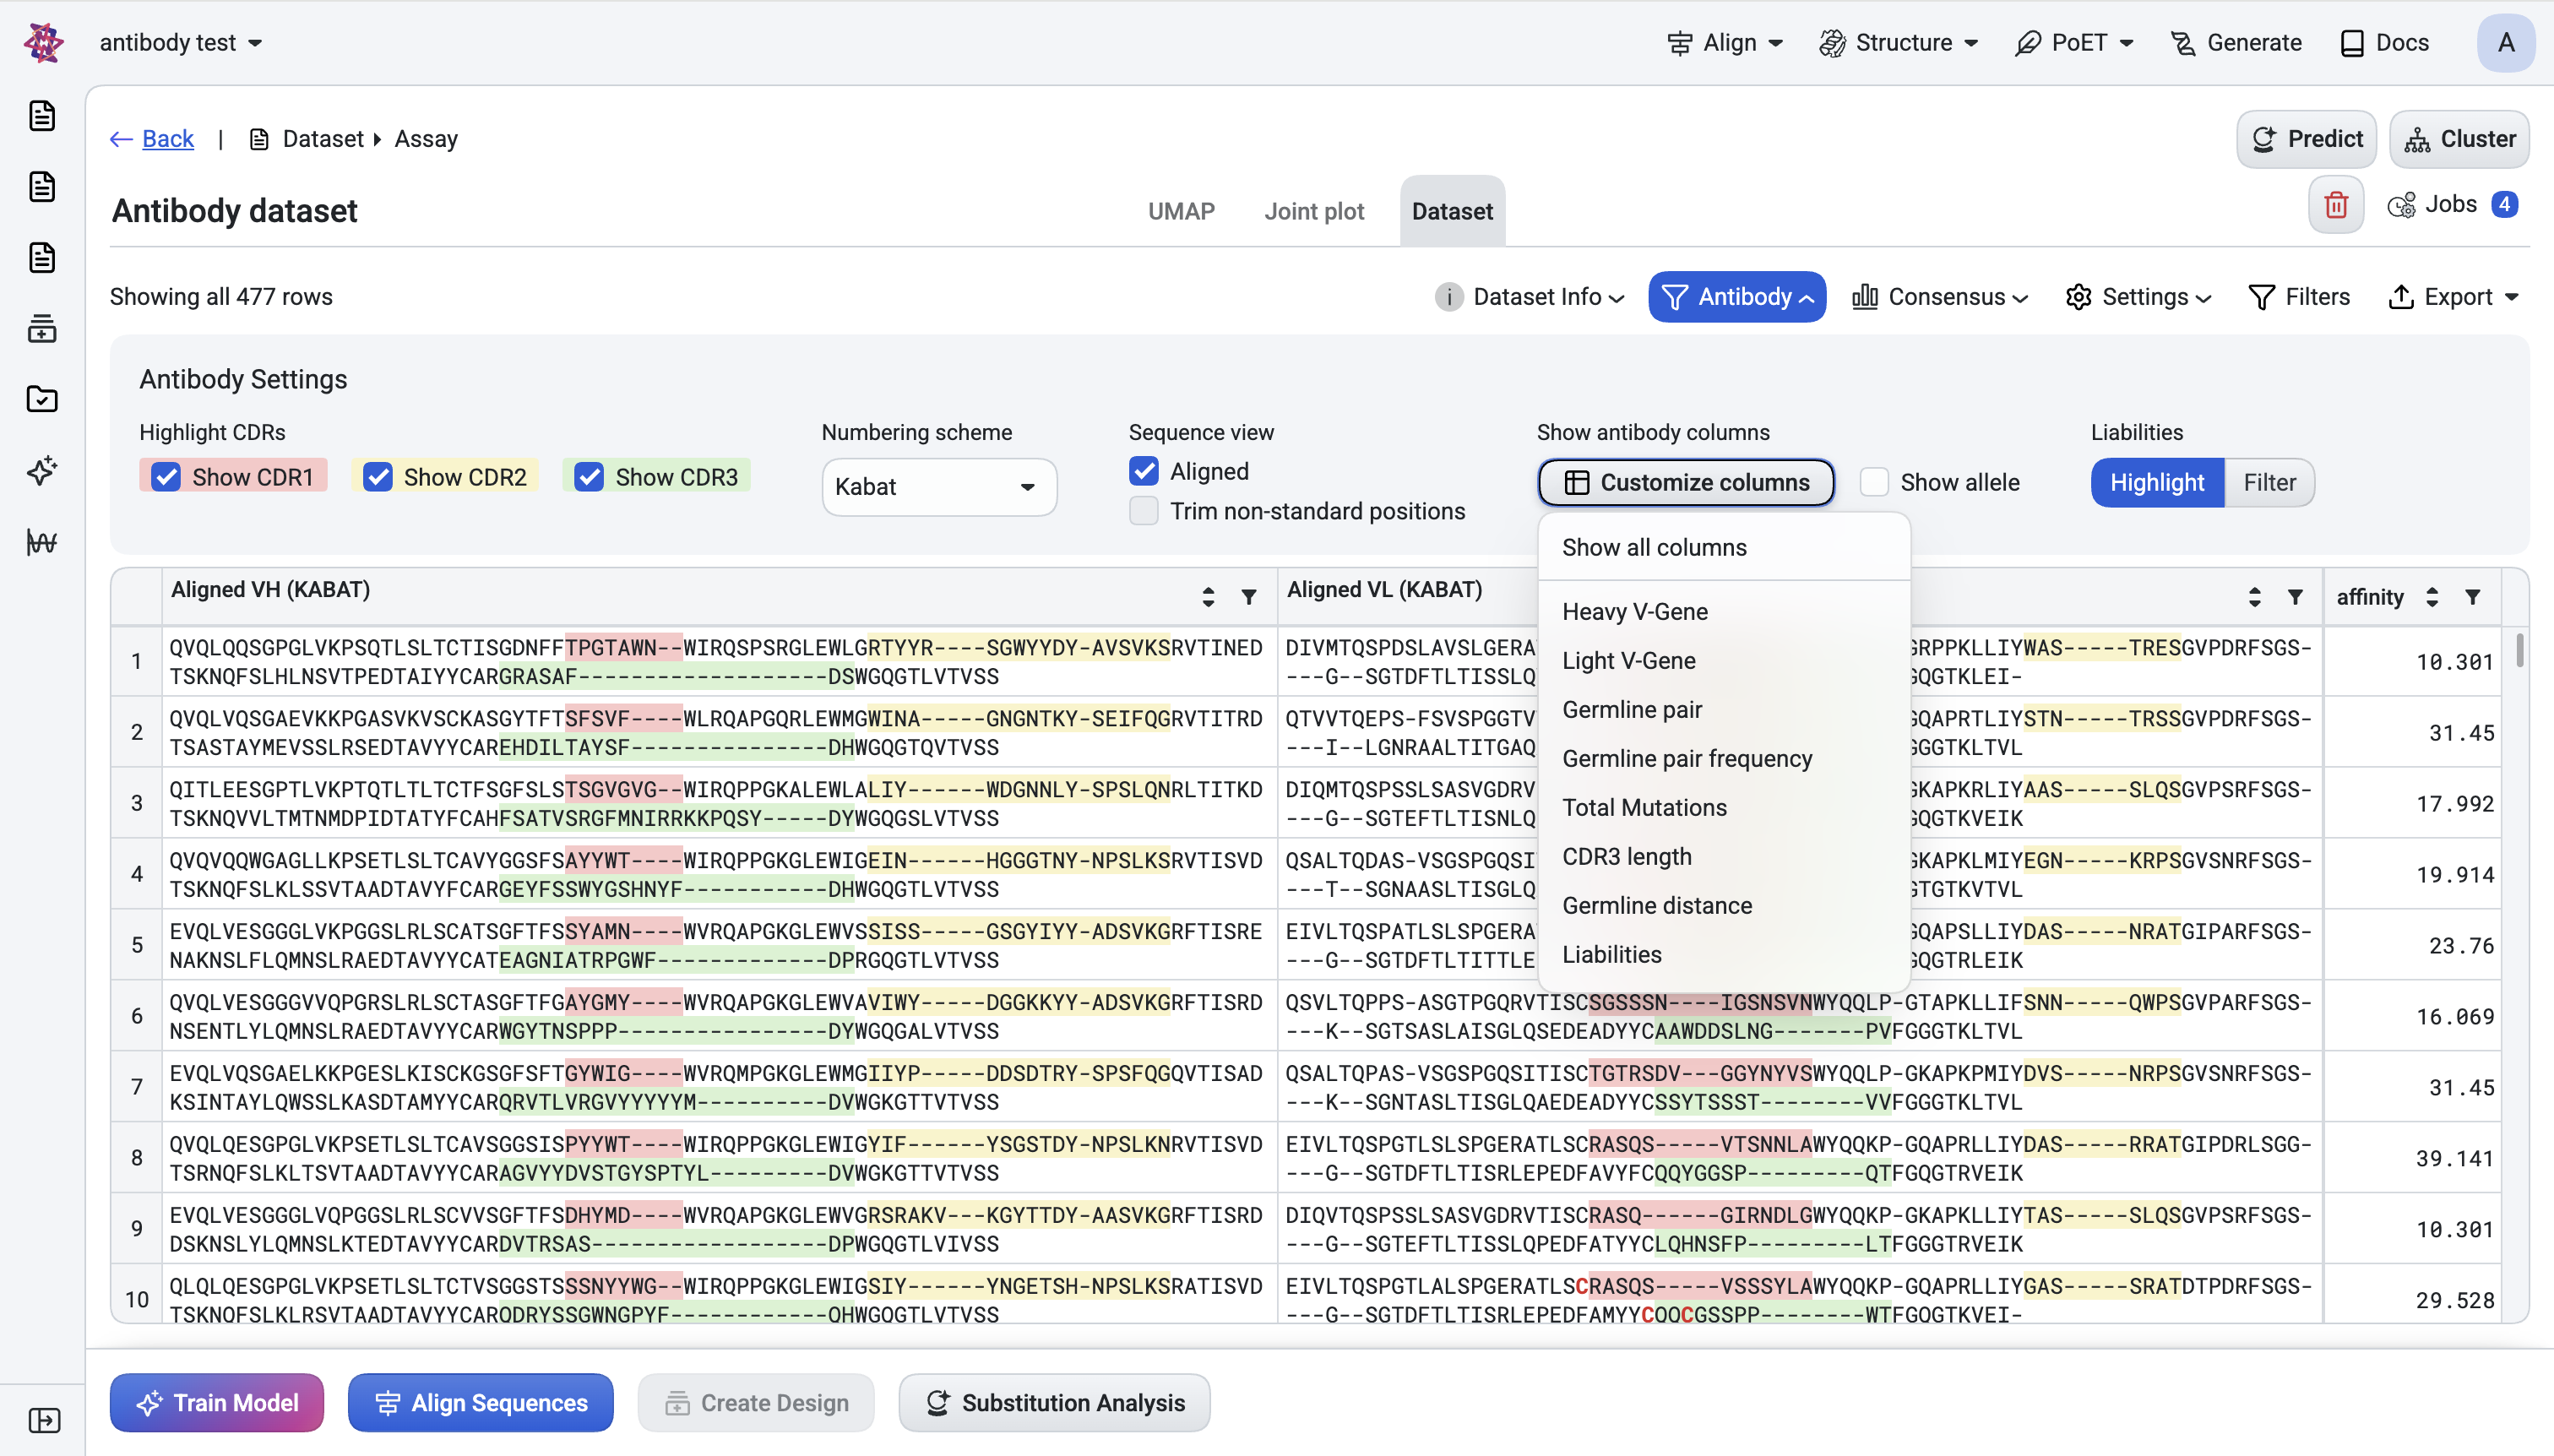
d. Show antibody columns#
- Customize columns — Opens a checklist menu where you can toggle each antibody annotation
column on or off to tailor your table view. Column options remain disabled until the antibody annotation pipeline completes processing, then become available for selection based on your analysis needs.
Show allele — toggles the allelic suffix (e.g.
*01) in V-gene and germline-pair values. Disabled by default to maintain clean, readable display. Enable when you need allele-level resolution for analysis. This setting affects the display format of Heavy V-Gene, Light V-Gene, and Germline pair columns—the underlying data values remain unchanged.
Column |
What it shows |
Use it for |
|---|---|---|
Heavy V-Gene |
IGHV gene call (e.g. |
Restrict to a V-gene family |
Light V-Gene |
IGKV / IGLV gene call |
Restrict to a light-chain family |
Germline pair |
Heavy + light germline combined (e.g. |
Group/sort by germline pairing |
Germline pair frequency |
Number of rows in the dataset sharing this exact pair |
Find dominant pairings in the library |
Total Mutations |
Heavy + light somatic mutations vs. germline |
Distinguish naive vs. affinity-matured clones |
CDR3 length |
Heavy CDR3 length |
Filter by CDR3 length distribution |
Germline distance (%) |
Mutations / sequence length × 100 |
Length-normalised mutation load |
Liabilities |
N-glycosylation motifs and unpaired cysteines highlighted in the aligned sequence |
Quick developability triage |
These columns automatically integrate with Advanced Filters (Group by / Sort by / Column filter), so once you’ve enabled them in your table view, you can immediately filter and sort by these properties without navigating away from the Dataset tab.
Heavy/light handling. Once the dataset is detected as antibody and chains
are split, the original Sequence column is replaced by Sequence VH and
Sequence VL (or “Aligned VH/VL” in aligned mode). You always see both
chains.
NGS-derived libraries. If the library mixes chain types (e.g., some Heavy+Kappa rows and some Heavy+Lambda rows, with mismatched/missing chain detection is flagged in the table with a warning style — useful as a first-pass quality check on the NGS pipeline output.
See also
Antibody hit selection from NGS data — recommended end-to-end flow that uses these features to select antibody hits from an NGS library.